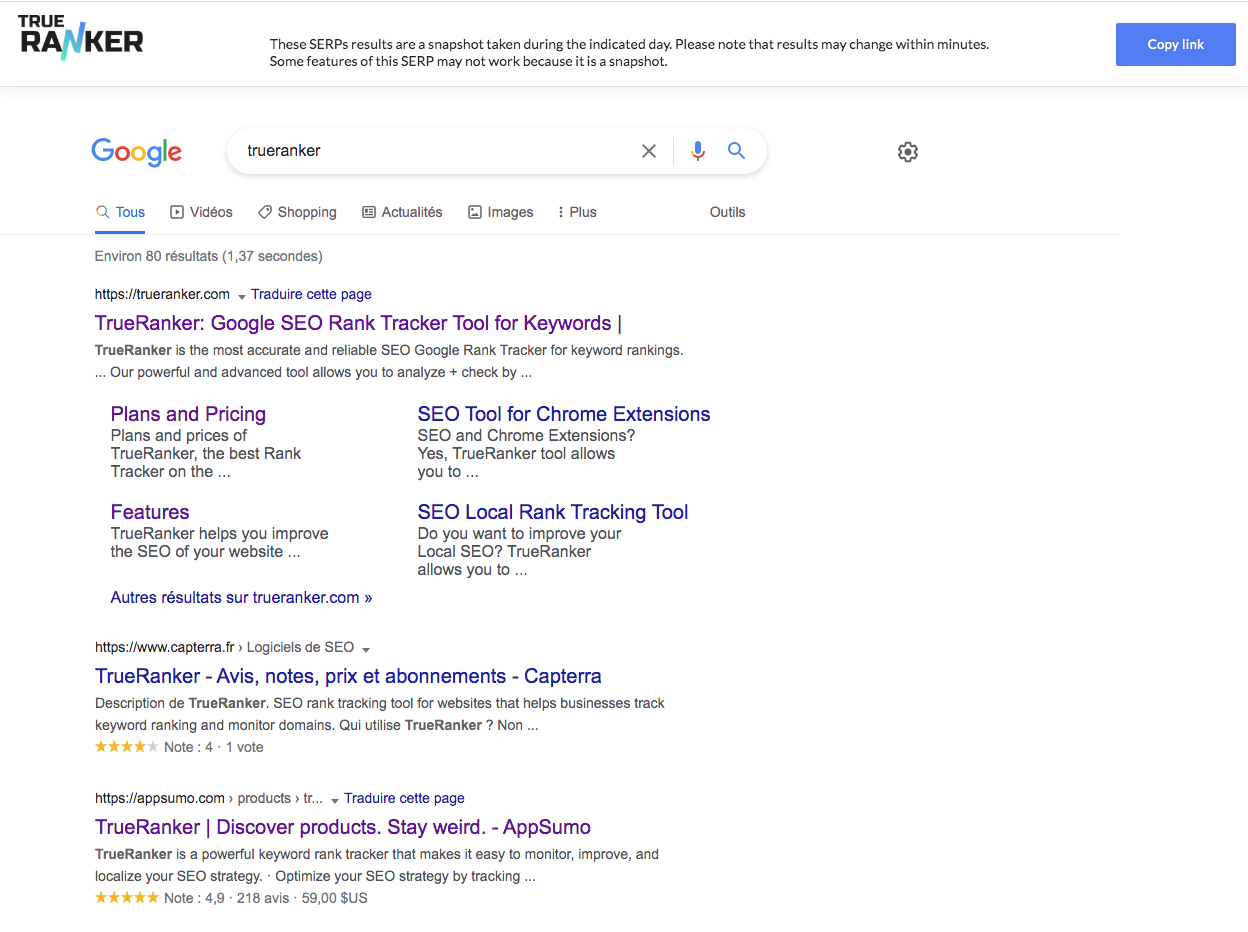
When viewing the SERP for a keyword (magnifying glass icon in the actions column), it would sometimes display incorrectly, even showing code from the page itself.
AI overview and GSC charts were not displayed for multi-users
Even if the main account had the AI overview and GSC extra data features enabled, the sub-accounts were not seeing these charts on the rank tracker page.
Google's search results pages are increasingly taken over by features that don't look like traditional results, and they affect your visibility whether you rank in them or not.
We now track which SERP features appear for each of your keywords:
Images
Videos
Local Pack
Knowledge Panel
Places / Directories
Forums & Discussions
Product Grid
People Also Ask
And more..
You'll see which features are active for a given keyword, and whether your site or a competitor appears in them. It gives you a clearer picture of the full SERP landscape.
🚀 New 360º dashboard: SEO, authority, and AI presence
We have centralized your entire strategy in a single view. From now on, you can monitor your progress on Google, your link profile, and your real visibility in AI models (LLMs).
New Feature: Google Data Studio Connector Now Available!
We are excited to announce the latest addition to TrueRanker: the Connector for Google Data Studio! Now, creating insightful reports of your keyword positions has never been easier.
Get your API Key and connect your application here: https://lookerstudio.google.com/u/0/datasources/create?connectorId=AKfycbx_VBHIdXiyIrC8GJQJl2GFqTUsup6ITCGmpgid6DA6TNOKvQcDn3WWpsvo-XtAhbAZ
With our new connector, you can seamlessly integrate your TrueRanker data into Google Data Studio, allowing you to visualize and analyze your keyword positions in a more dynamic and customizable way. Say goodbye to manual data entry and hello to automated, visually appealing reports that showcase your SEO performance.
Start date data was not displayed on the dashboard
We have fixed a bug that caused the charts to not display data for the initial date of the selected period when the project had a tracking frequency greater than 1 day.
Now, the charts will reliably display data from the first point in the period, regardless of the frequency used.
Previously, in projects configured with a tracking frequency that was not daily, the columns indicating position changes (relative to 1, 7, 30, and 90 days) were often not displayed. This occurred because, without daily tracking, the data for the exact dates required might simply not exist.
The new methodology improves this by searching for the closest data:
Now, when we calculate the position change, the system will search for the necessary data as many days back as configured in the project tracking options (for example, 3 or 7 days), instead of limiting itself to a single date.
Practical Example
Imagine that your project is configured to track the Top 100 positions every 7 days and today is December 9:
For the 1-day change (vs. yesterday): Instead of searching only December 8, the system will search for the most recent position it has, checking from December 8 to 7 days before (i.e., up to December 2).
For the 7-day change (vs. a week ago): It will search for the most recent position by checking from December 2nd to 7 days before.
For the 30-day change (vs. a month ago): It will search for the most recent position by checking from November 9th to 7 days before.
📌 Important Consideration: Selected Period
Please note that these changes are only checked within the time period you have selected to view. If you have chosen to view data from only 2 months, the change over 90 days (3 months) will not be shown, as the comparison date falls outside the selected period.
Big news – we just launched Backlinks Monitoring & Discovery in TrueRanker! You asked for it, it took us time, we built it. Now you can protect your most valuable SEO asset: your backlinks.
What You Can Do Now:
📊 Monitor Your Backlinks 24/7 Add the backlinks you've worked hard to get (guest posts, partnerships, paid links) and we'll check them daily to make sure:
They're still live
They point to the right URL
They have the correct anchor text
The rel attributes are right (follow/nofollow)
Never lose a valuable backlink without knowing it.
🔍 Discover Hidden Backlinks Find backlinks you didn't know about, pointing to your site or your competitors. Perfect for:
Introducing Google AI Overview Reporting in TrueRanker!
Google’s AI Overviews are here, and they’re changing the SEO game. Starting today, TrueRanker gives you visibility into how Google’s AI Overviews (formerly SGE) are displaying your keywords, and whether your brand and content are making it into the spotlight.
We’ve added 3 powerful new indicators right into your keyword table:
1. AI Overview Triggered?
Know instantly if a keyword shows an AI-generated answer in Google. Understand which queries trigger AI answers and which don’t, so you can adjust your SEO strategy accordingly.
2. Is your URL Getting Cited?
We scan the AI Overview and tell you if your website’s URLs are cited.
If you’re not being cited, you’ll know. If you are, it’s time to double down.
3. Is Your Brand in the Conversation? See whether your brand name (e.g., TrueRanker) is explicitly mentioned in the AI Overview text.
No more guessing if Google sees you as an authority. Now you’ll know. Perfect to track brand visibility, topical authority, and E-E-A-T signals.
We’re not stopping here. In the coming weeks, we’re rolling out historical tracking, so you’ll be able to see the full story: how your citations, brand mentions, and AI visibility evolve over time.
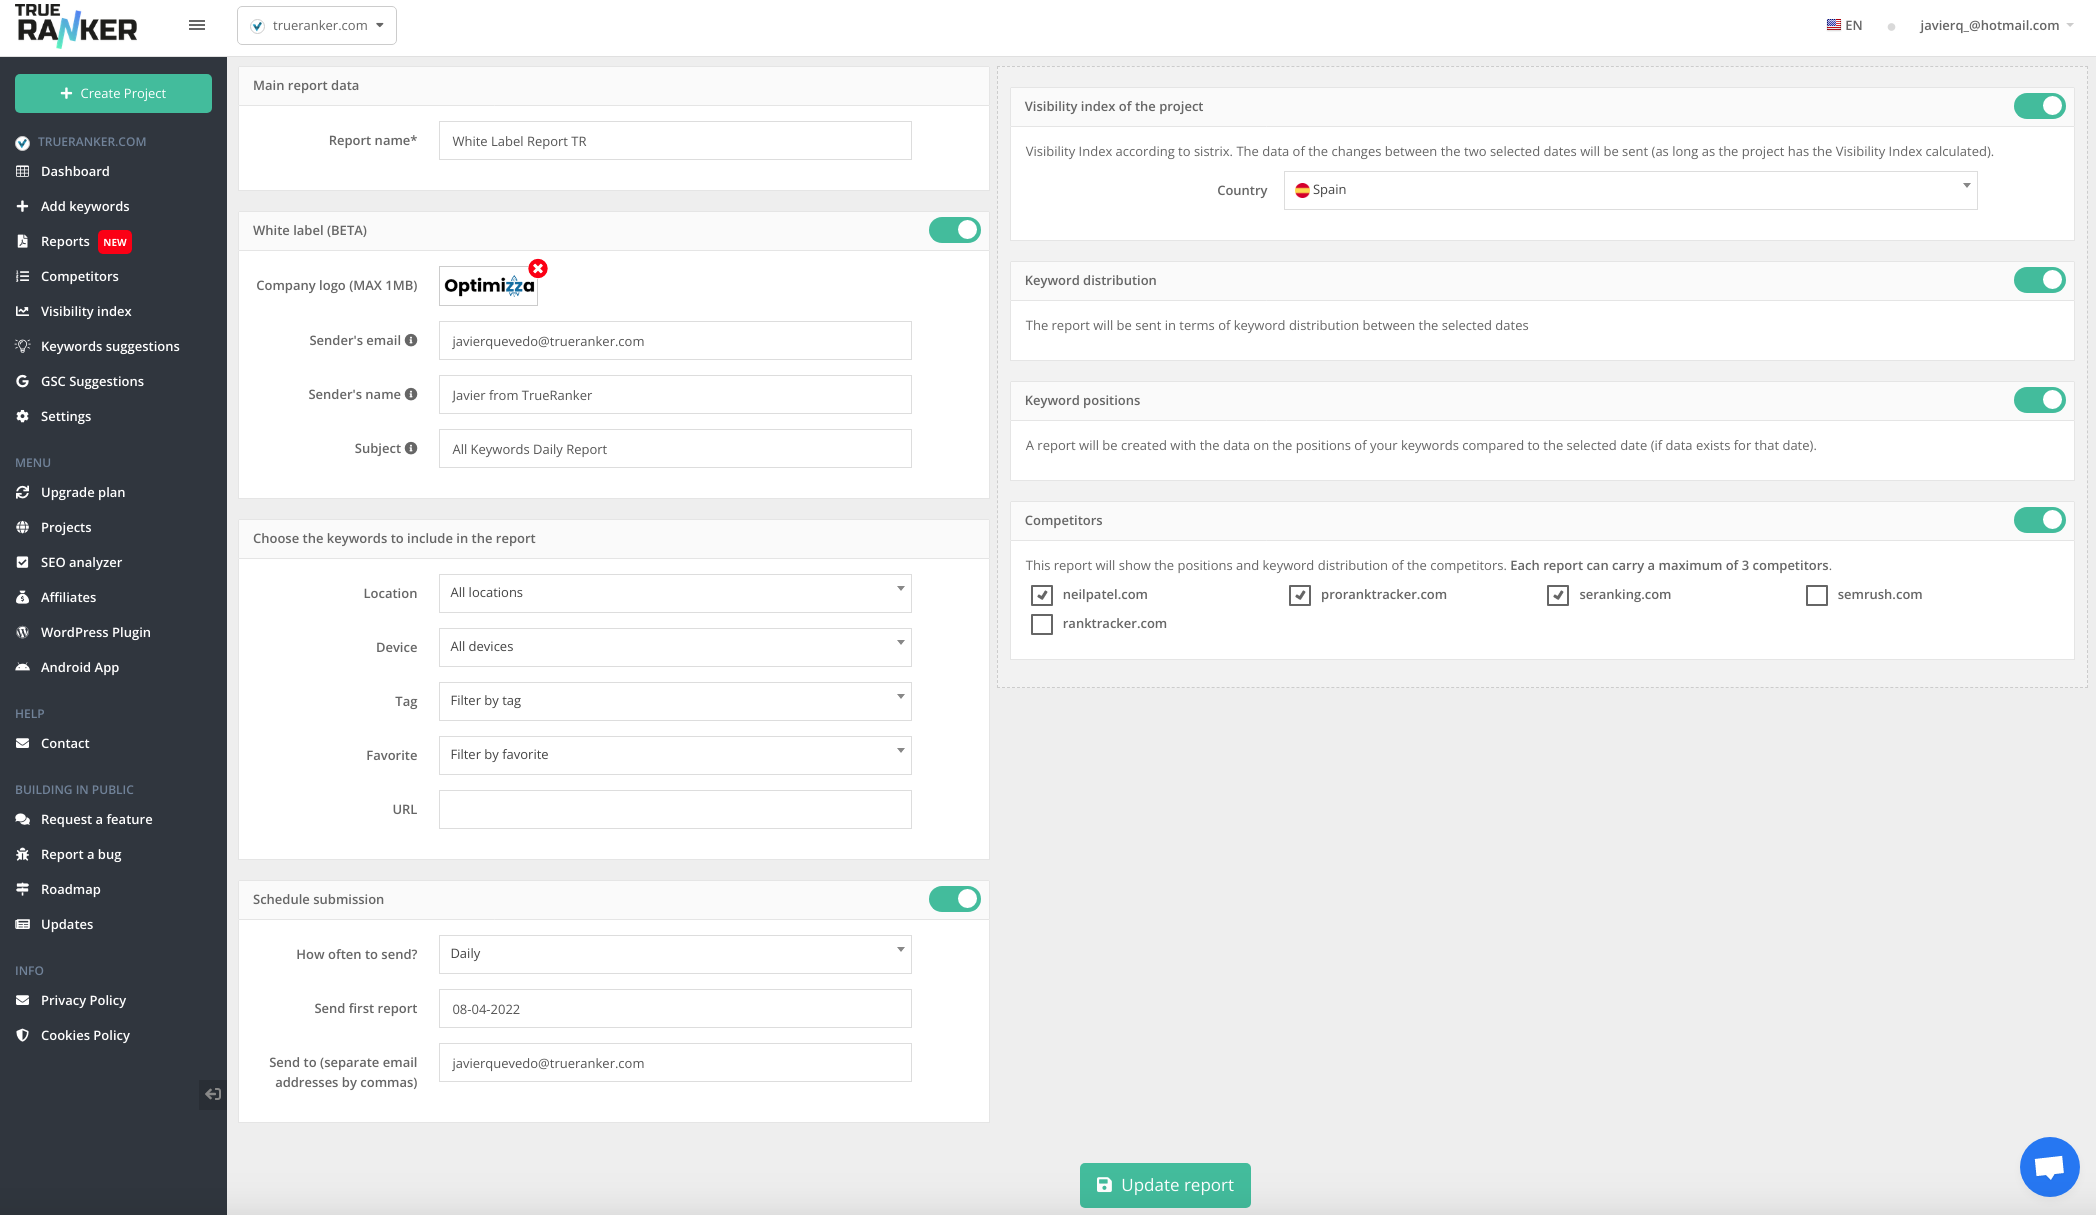
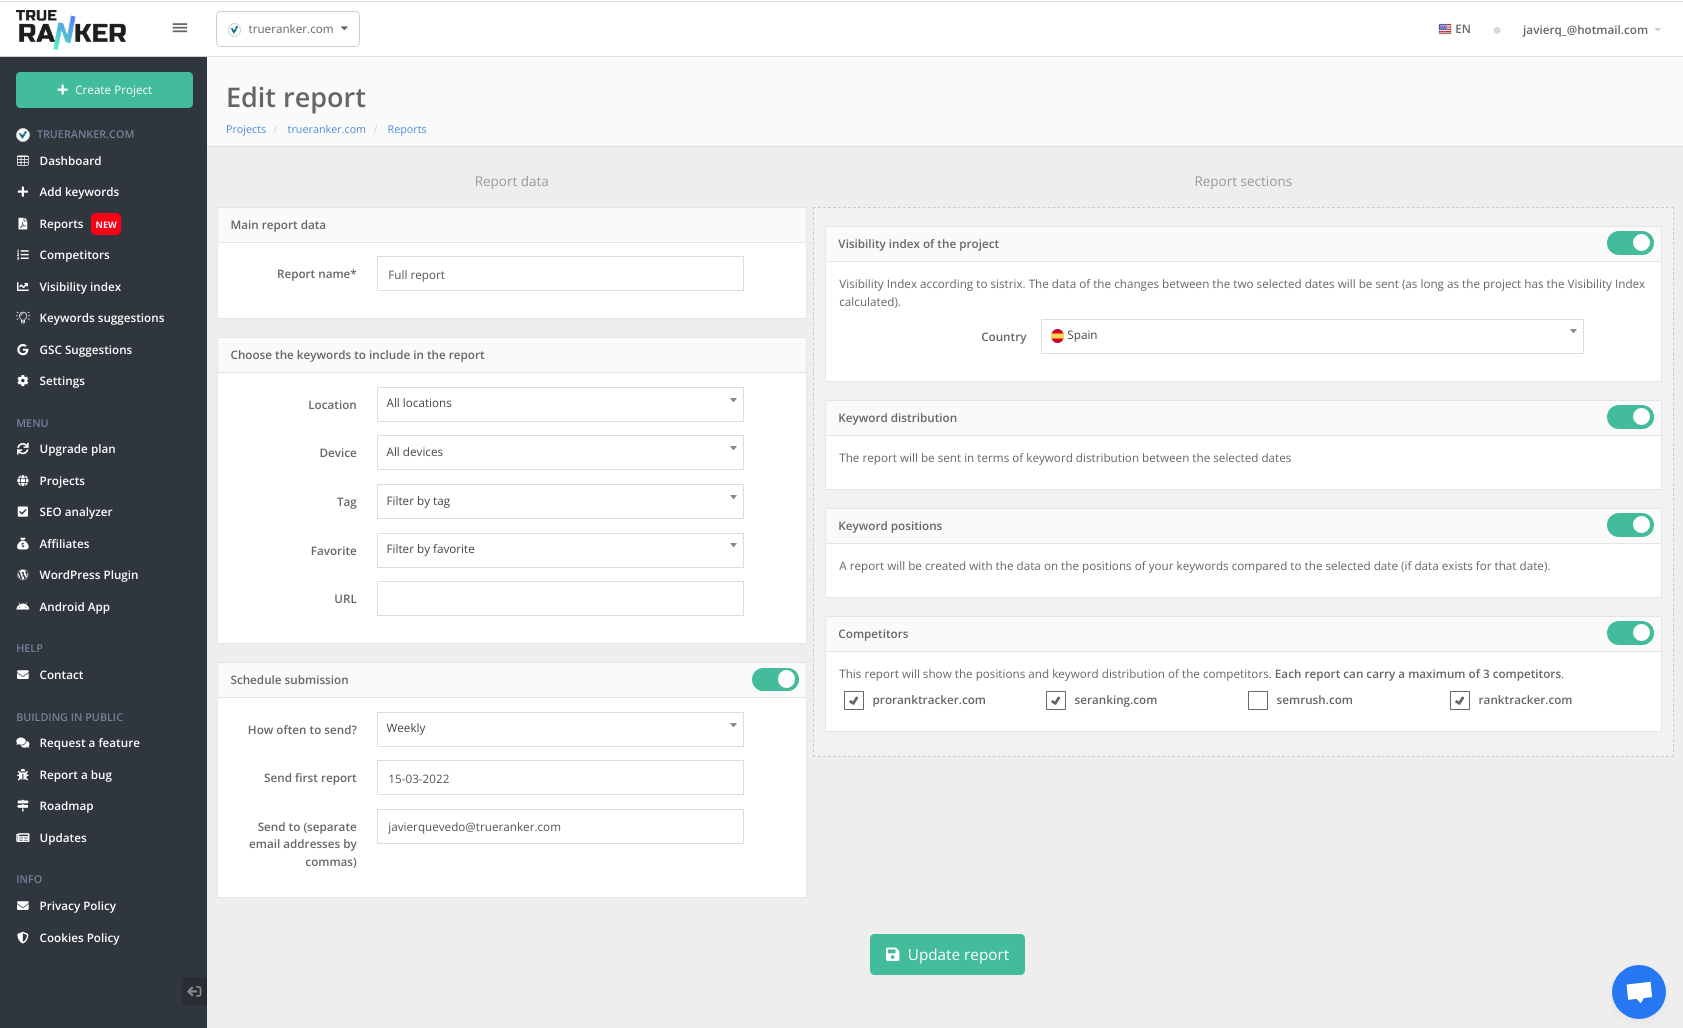
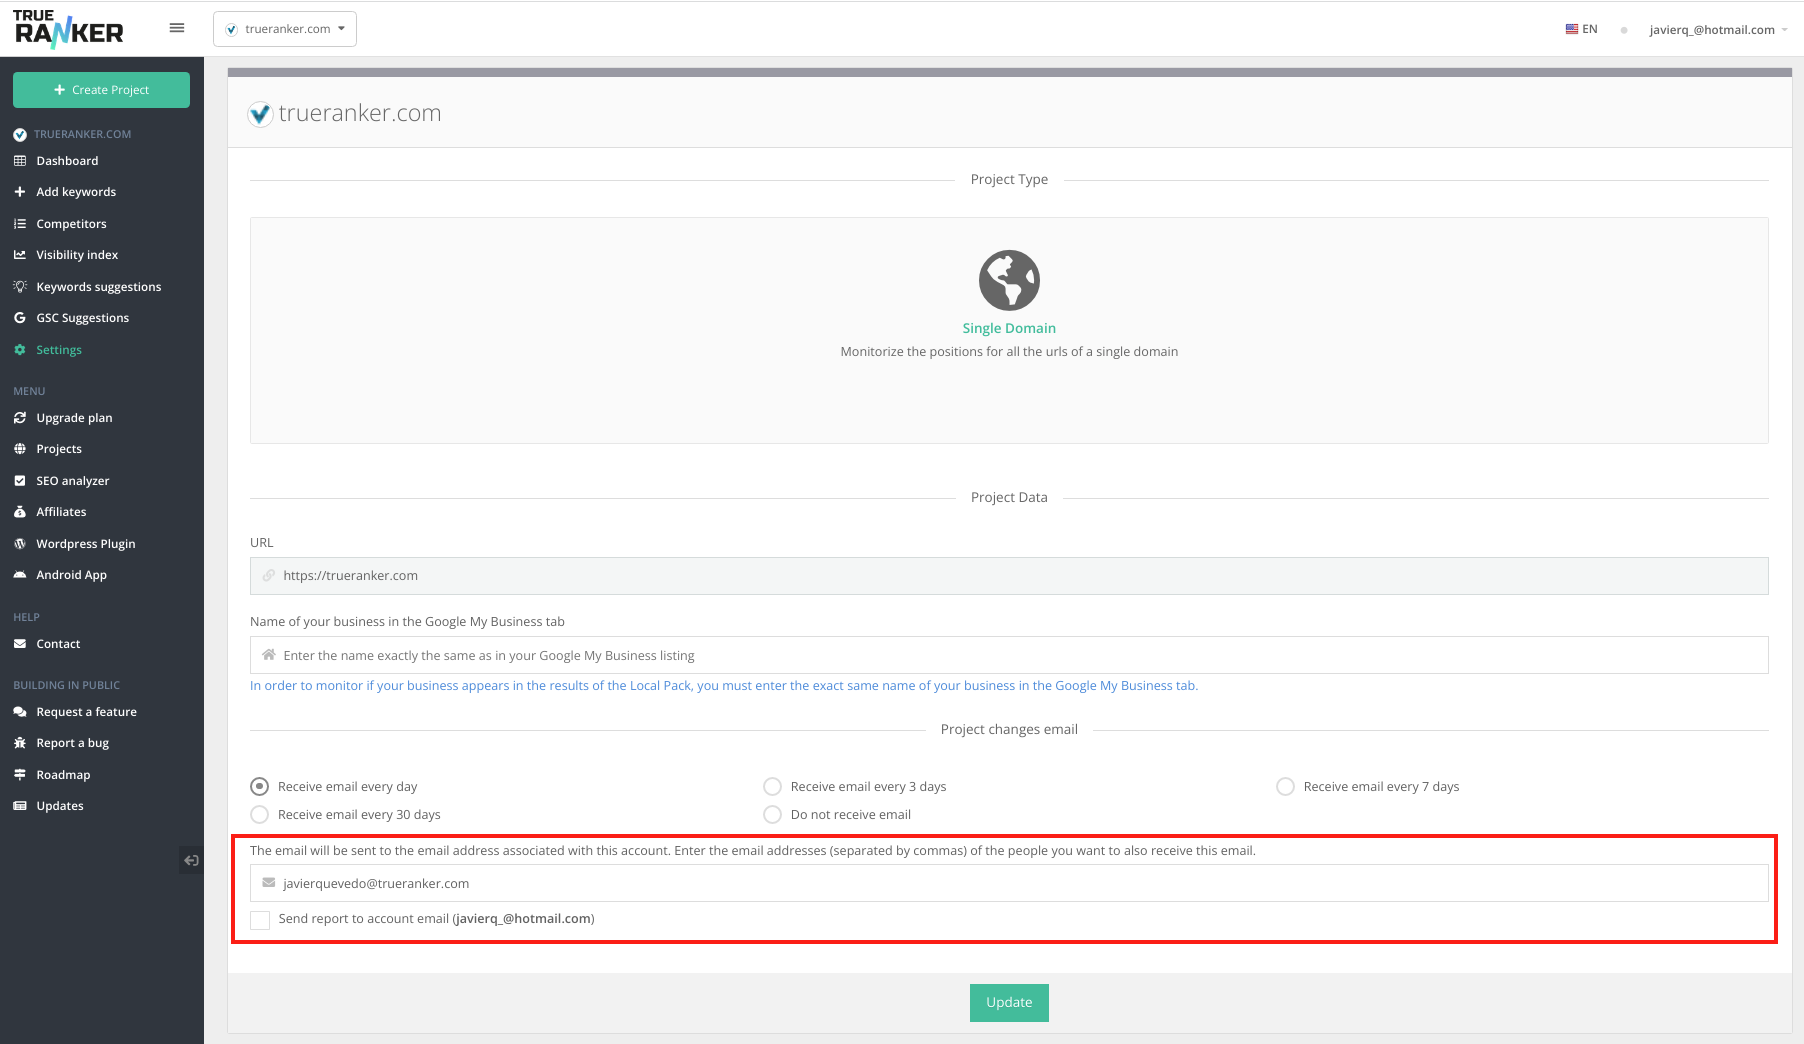
Customize the data to display in the Shared Project
Sometimes you do not want to display certain columns or data to certain clients. Now, you can customize what they see, either you are using a White Label shared project or not.
Starting Column - Now displaying the positions change since the starting position
"I have been working in this website since I added those keywords for a while now, and the positions are way higher than we started, but I don't remember, has it been a big change?" - Have you ever thought that? or have a client asked you what is the change since you started working in the project? Now in the column "Starting" you can see both the initial position when you added the keywords and the positive or negative change with an indicative arrow.
When migrating to TrueRanker from another platform, you may want to keep the initial position as the one that you had in the previous tool, so that you can show to your clients or to keep track of how it was before and after. Select the keywords and modify the starting rank from the Batch Actions menu.
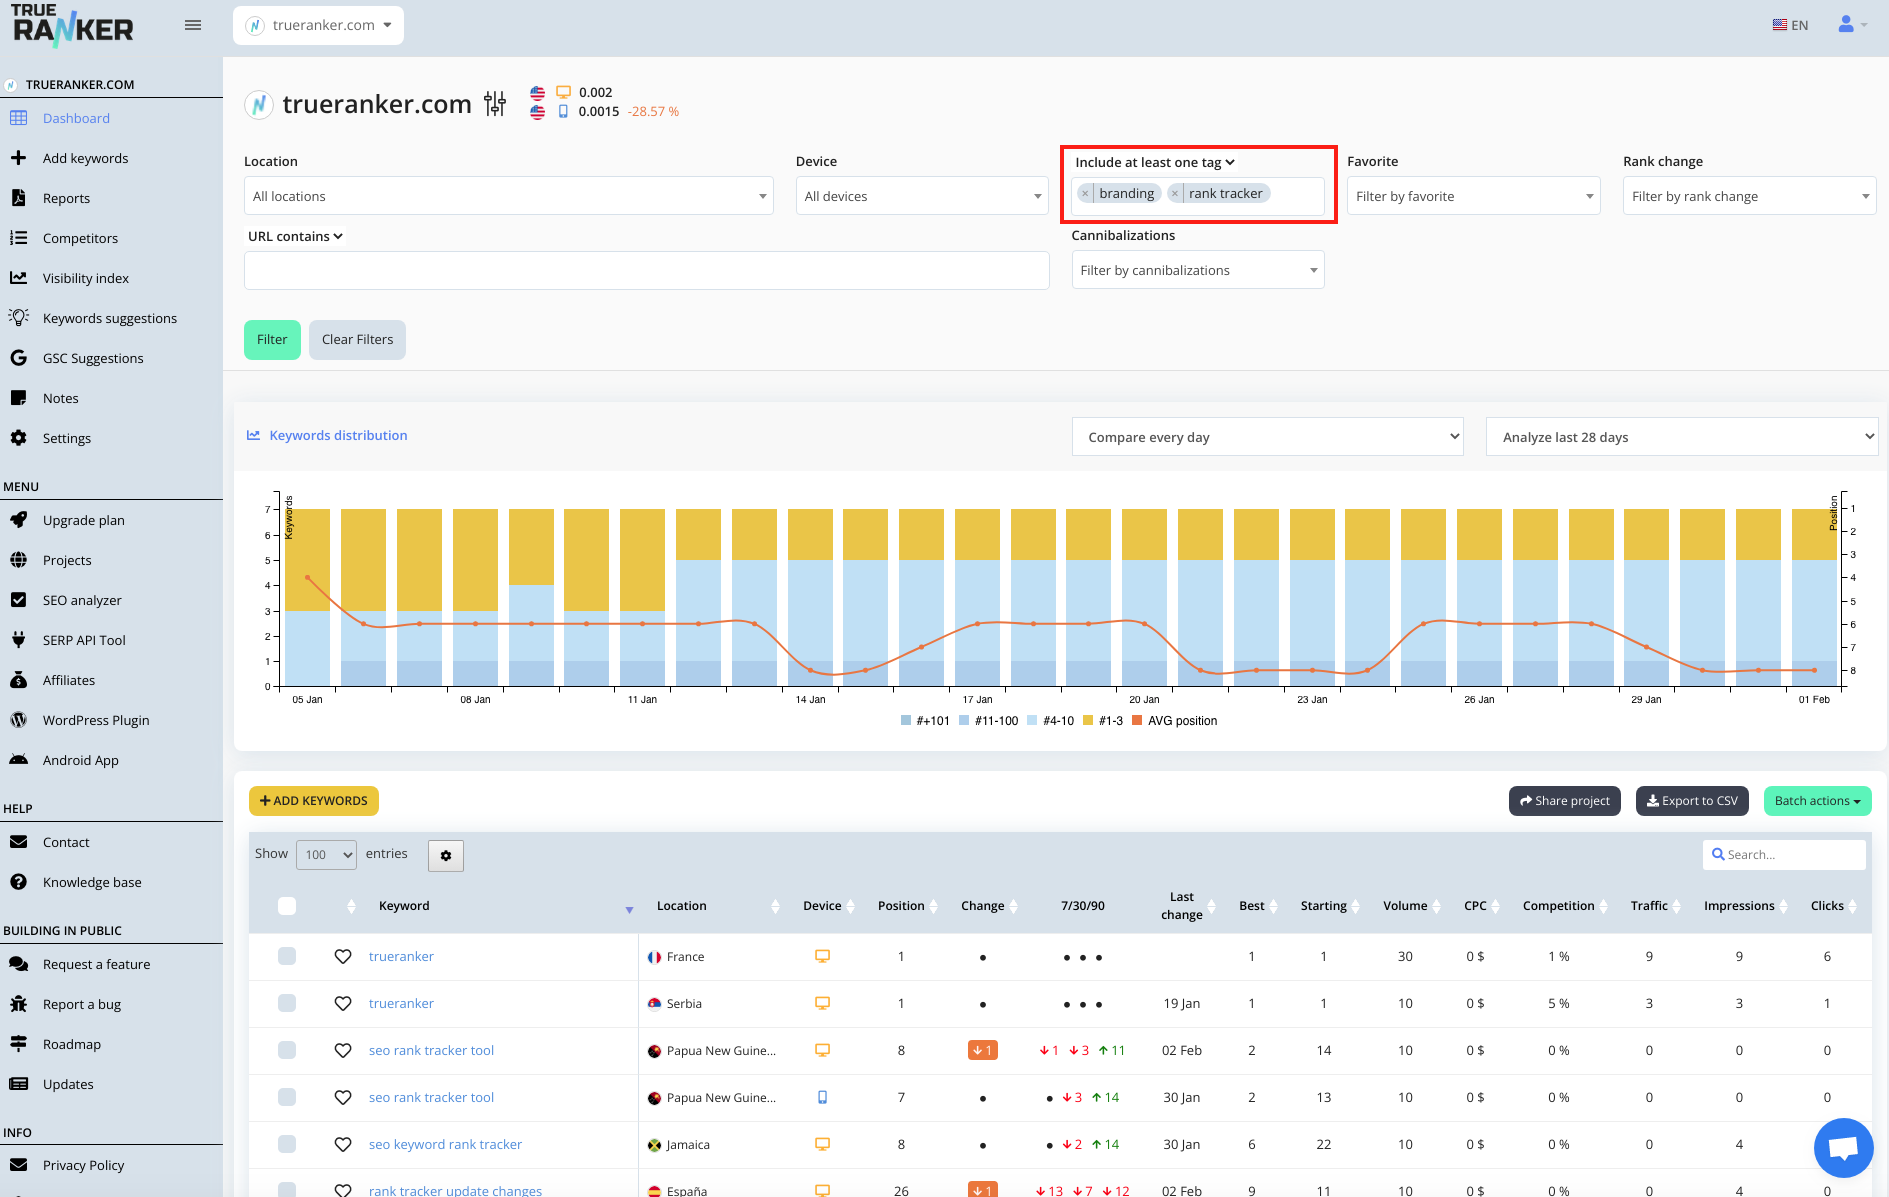
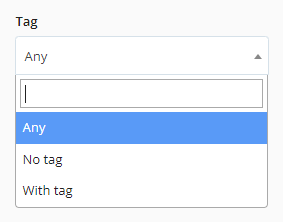
With the latest update, you now have more options in TAG and URL filtering, making it easier than ever to find the exact data you need.
TAGS filter options
Include at least one
Include all tags
Does not have this combination of tags
Does not have one of these tags
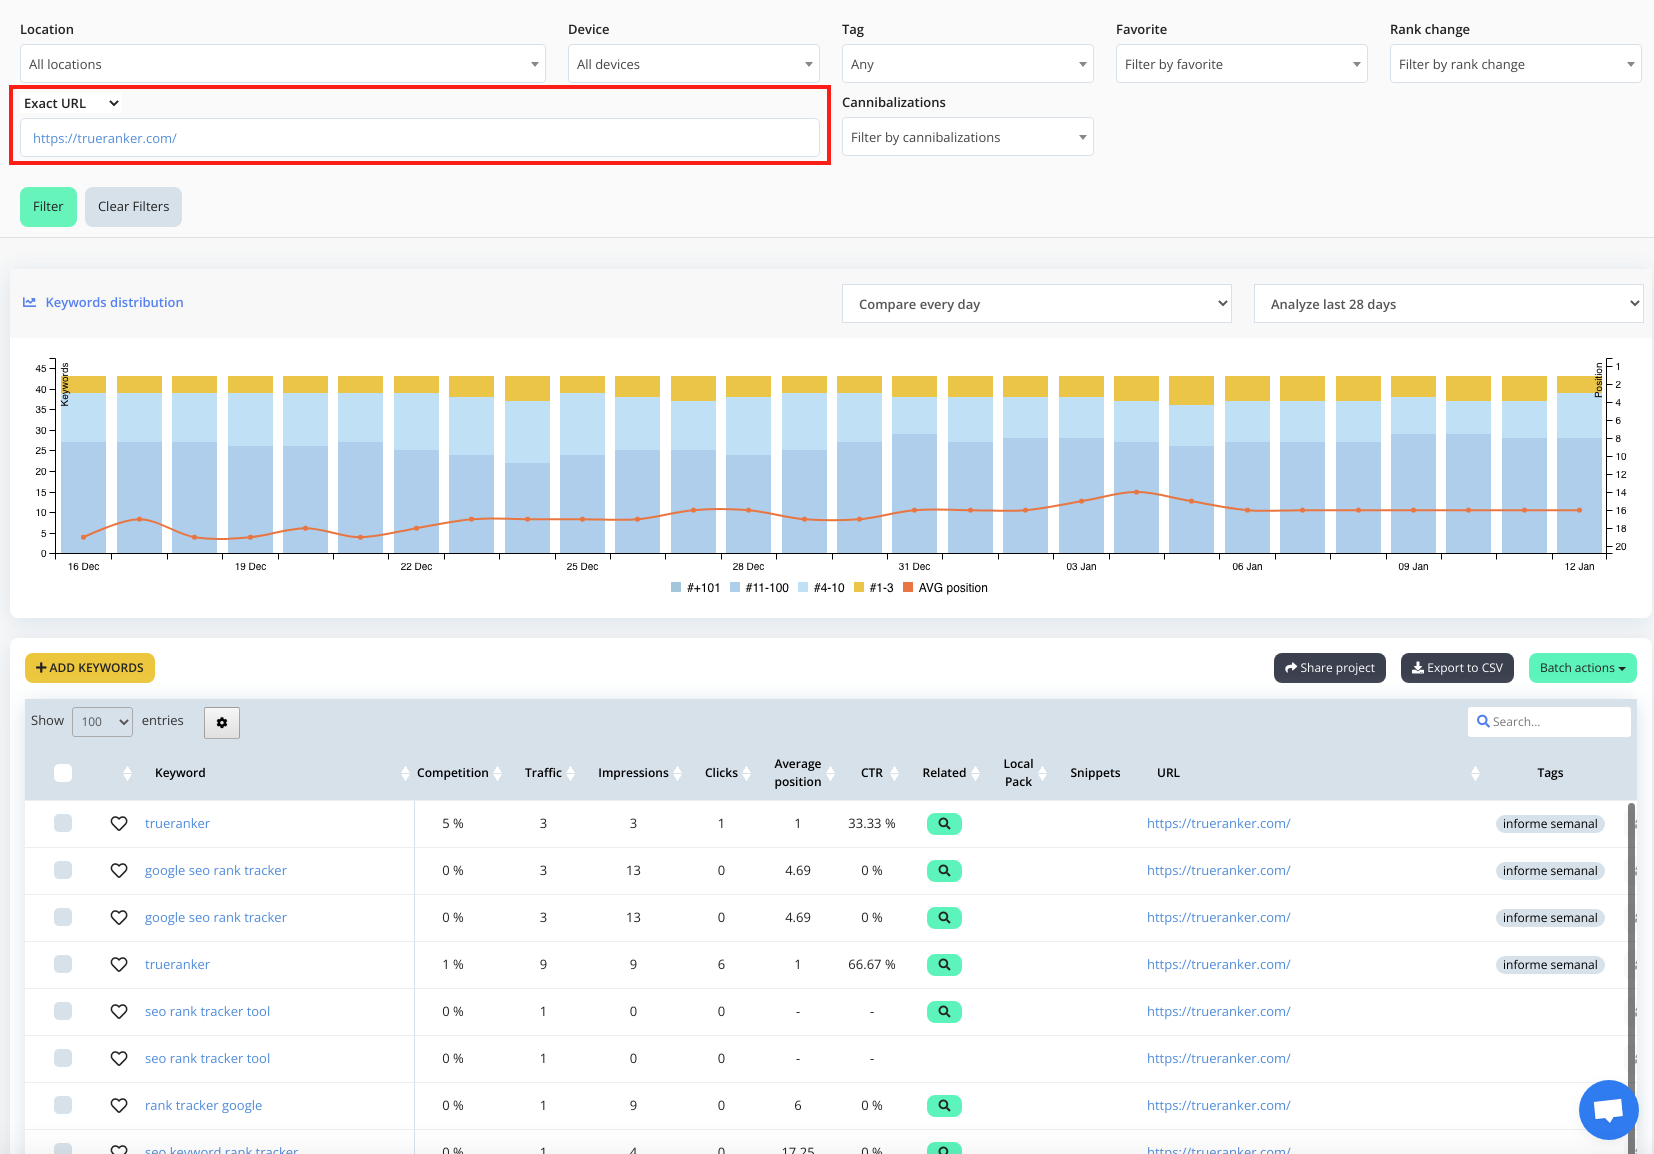
URLS filter options
URL contains
URL does not contain
URL exact
Different exact URL
Whether you're looking to narrow down your keyword list, identify specific trends, or track the performance of keywords with certain attributes, these new filtering options have got you covered. Say goodbye to sifting through irrelevant data and hello to a more efficient, targeted approach to keyword management.
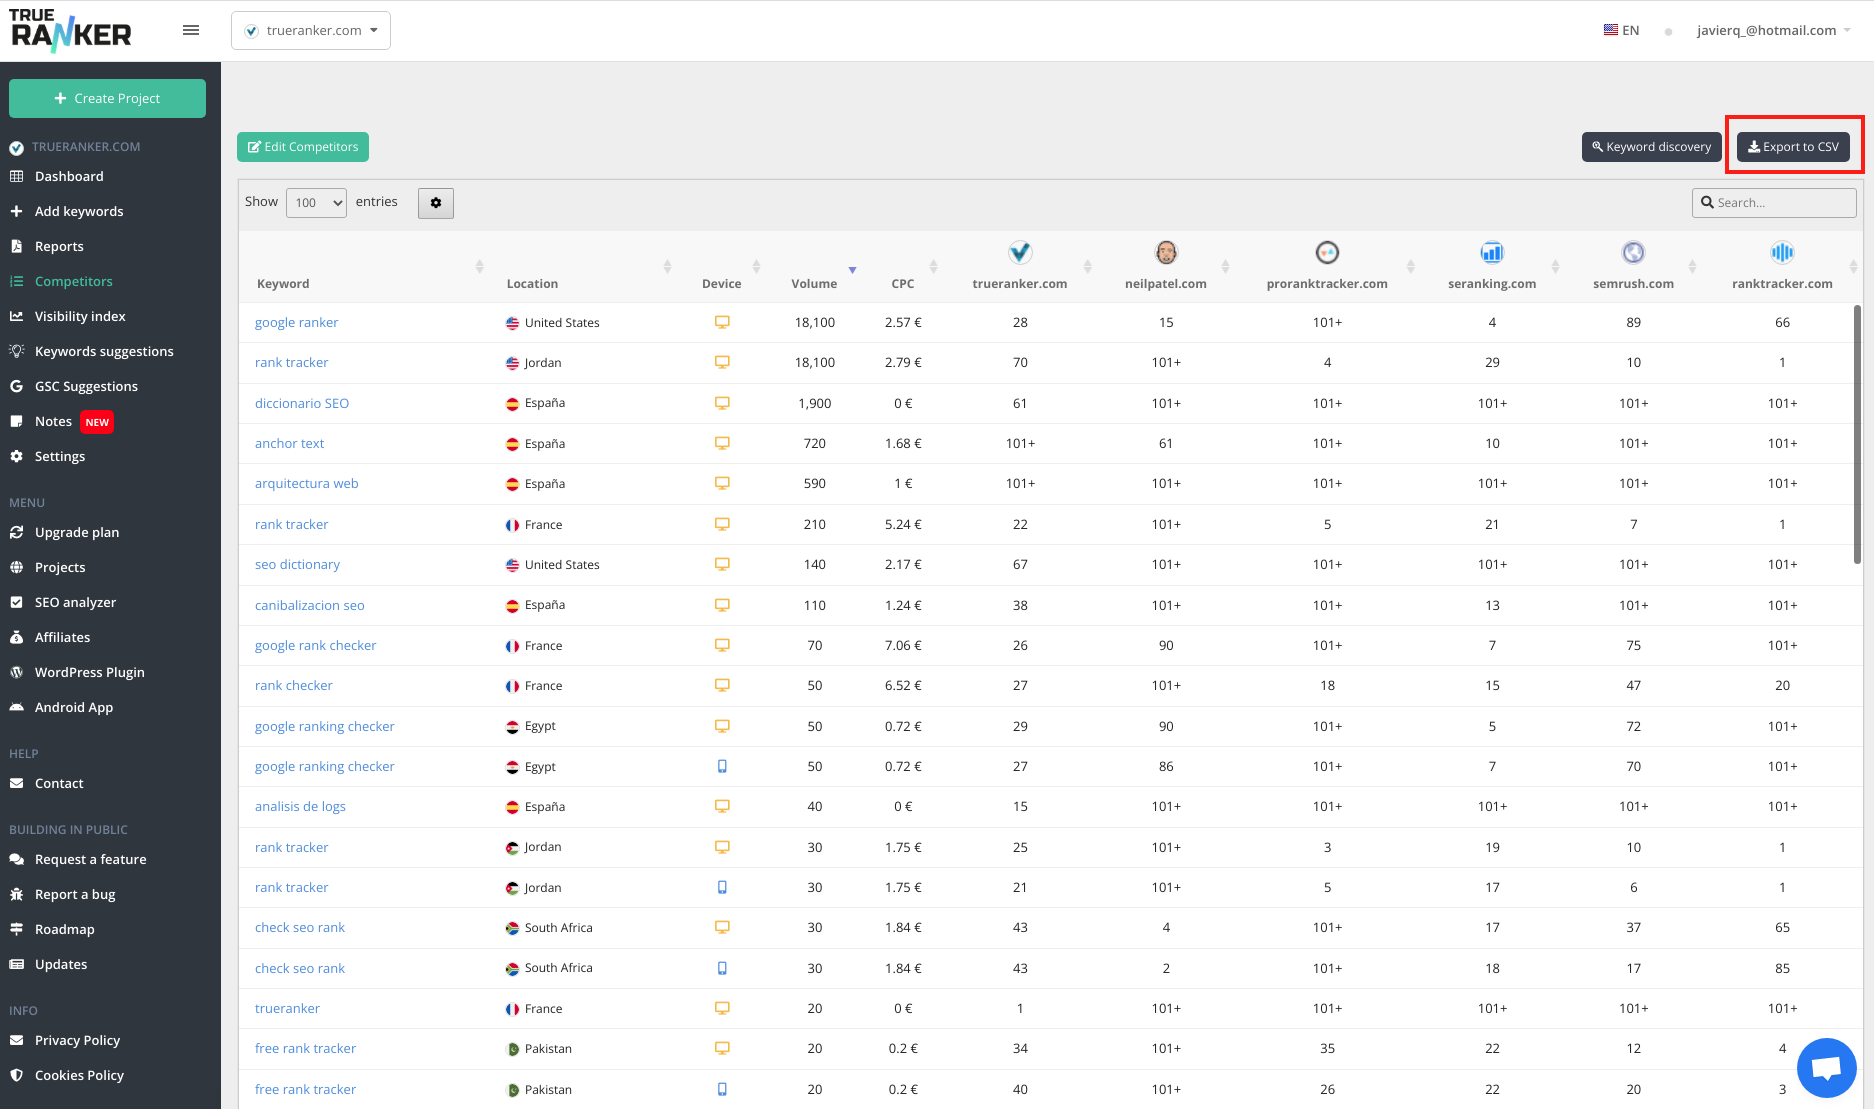
The function to export competitors to CSV did not work correctly when a filter was applied. The process did not take into account the filter(s) applied and exported all keywords. The bug has been fixed.
Impressions, Clicks and CTR. Google Search Console graphs of your keywords
Google Search Console (GSC) may provide you tons of keywords but you might only want to track some of them for your current projects. With TrueRanker, in addition to following the progress of your keyword positions, you can now see the progress of your Impressions, Clicks and CTR. This allows you to quickly compare how different metrics affect your SERP performance.
Similar to other graphs, you can view these metrics grouped by tags, location, device, etc., giving you a comprehensive overview of different lines.
We understand that the number of graphs was getting quite large and it was difficult to see in smaller screens. We've streamlined our graphs to make your data easier to view, especially on smaller screens. Plus, we've added new graphs to show average metrics by URL, keyword name, tags, or localizations.
Average Position Track the average position of your project over time. Group data by URL, keyword name, tags, or localizations to see each business line’s overview.
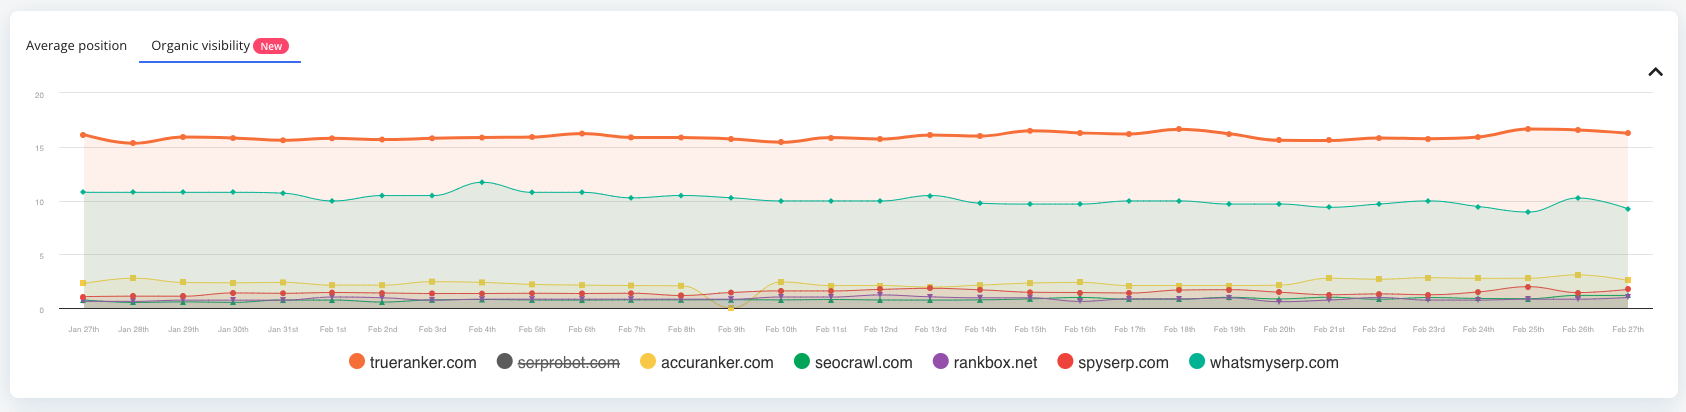
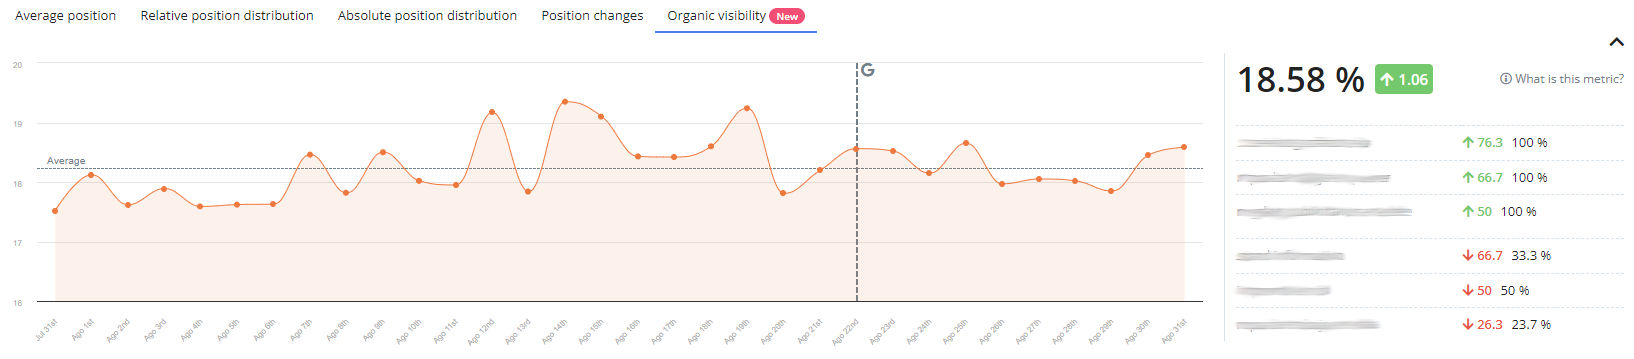
Organic Visibility Monitor your project's organic visibility progress. Group data similarly to the Average Position graph by tag, location, URL, etc.
Position Overview We've combined three graphs to show how your keyword positions are changing over time: Relative Position Distribution, Absolute Position Distribution, and Position Changes.
Competitors You can now see both the Average Position and Organic Visibility graphs under the Competitors navigation item.
Additionally, since the number of graphs is growing (and more to come), and we understand that each user may have different visualizations needs, to make your experience smoother, TrueRanker now remembers the last graph you viewed. So, if you were checking the Organic Visibility graph by tags, it’ll be the first thing you see next time, saving you clicks and time.
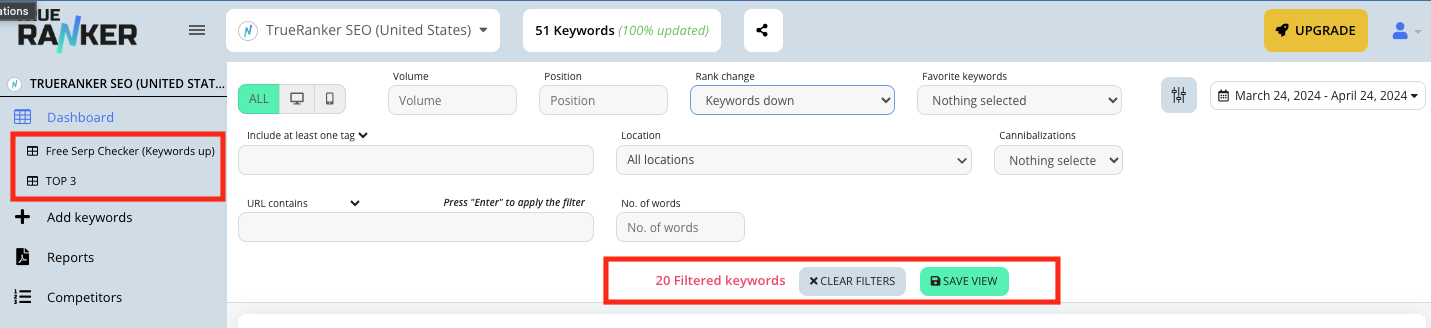
Do you use the same filters day after day, week after week to see the data of a specific group of your keywords? Say goodbye to repeatedly setting up filters every time you log in. With custom views you can now tailor your TrueRanker dashboard to suit your unique needs by saving your applied filters. Filtered views are now just a click away.
After applying your filters and saving your view, you will be able to see the shortcut access navigation on the left menu under the dashboard item.
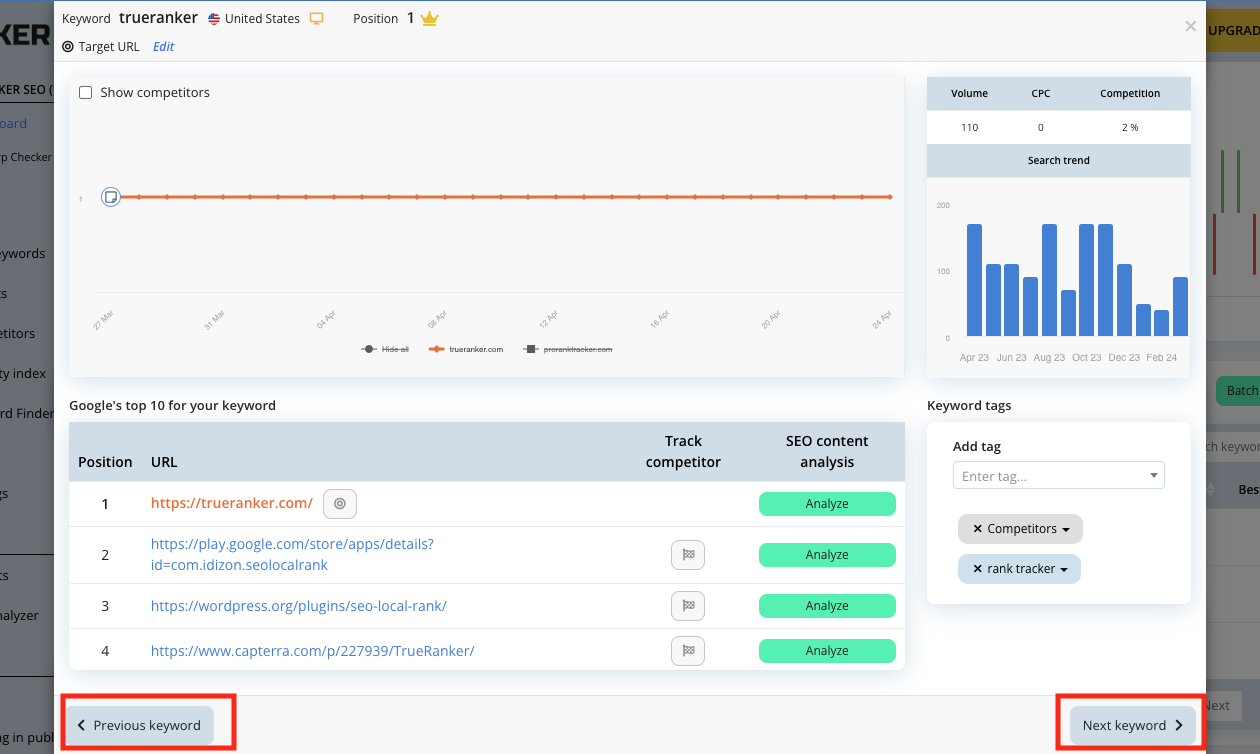
With this latest update, you can now easily navigate between your keywords right from the Keyword Popup. Click on the arrows buttons Previous and Next to explore each keyword independently.
Now, you can easily the average position visually of your tags, giving you a quick overview of which core is performing the best at a glance.
We have just released a new way to add and edit tags making very easy and fast to label your keywords by your business units, keywords groups, etc.. that you might need in your business. Now, you can also see the progress of these tags over time in a graph.
Stay tuned for more exciting updates as we continue to enhance your TrueRanker experience!
Do you have different business units in your project? Or are you targeting different audiences? Are you currently adding an extra effort in a group of keywords and you would like to see them differently?
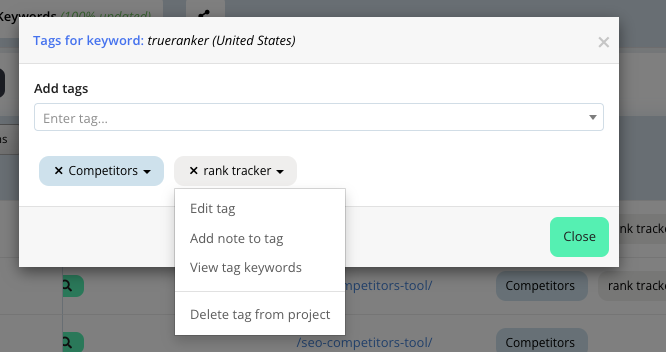
We have improved the tags system for easy labeling and we have improved the UX making even easier to edit your tags. Now you can rename the tags, edit the color of the tag for instant recognition or delete them when you don't need them anymore.
Apart of the editing tags options, you can also filter by tag, add notes to a tag, for example to remember a change that you might have done in your website on a specific day that could affect keywords in a tag; or group by tag in the keywords table, so that you can see the average position of each tag to get a quick overview of your project.
Next, we'll add the option to see a progress graph for your average position by each of your tags. Stay tuned!
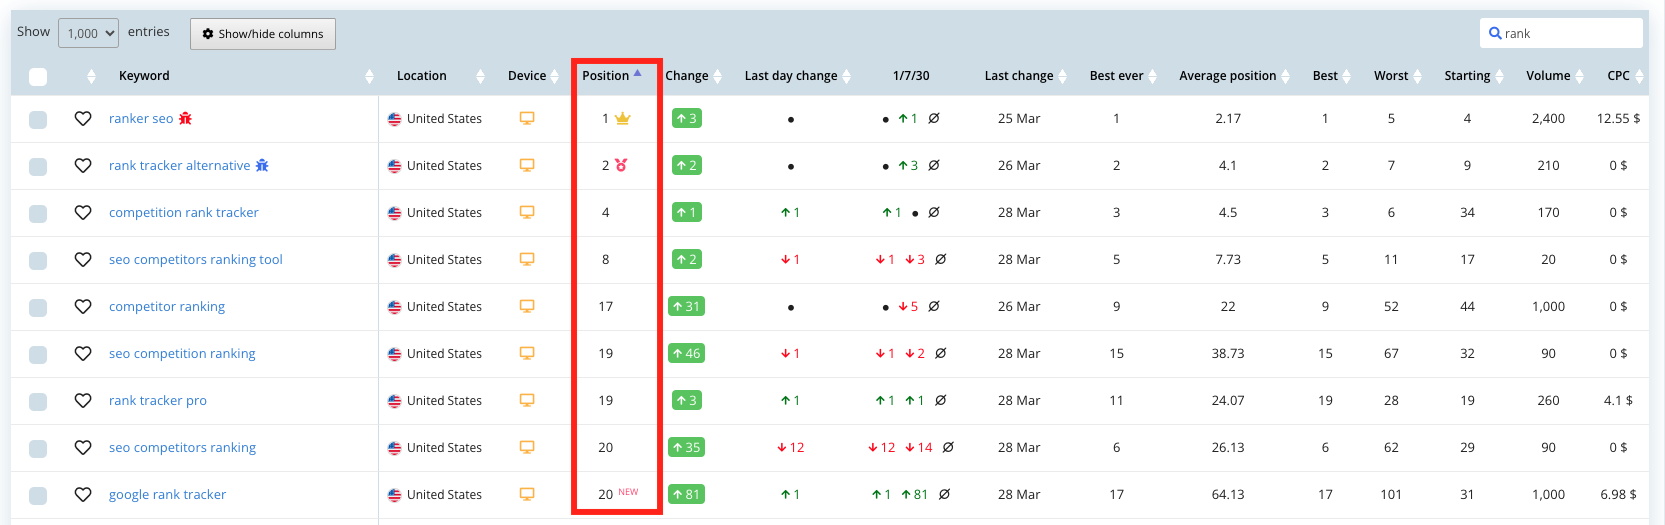
We have added several icons to make easier the viewing at a glance of the positions of your keywords.
"Crown" icon for the 1st position. "Red Medal" icon for best position ever (except 1st position, of course). "NEW" icon for keywords that enter the top 100 in the period selected.
Hey TrueRankers! Here at TrueRanker, we're all about making your SEO journey as smooth as possible.
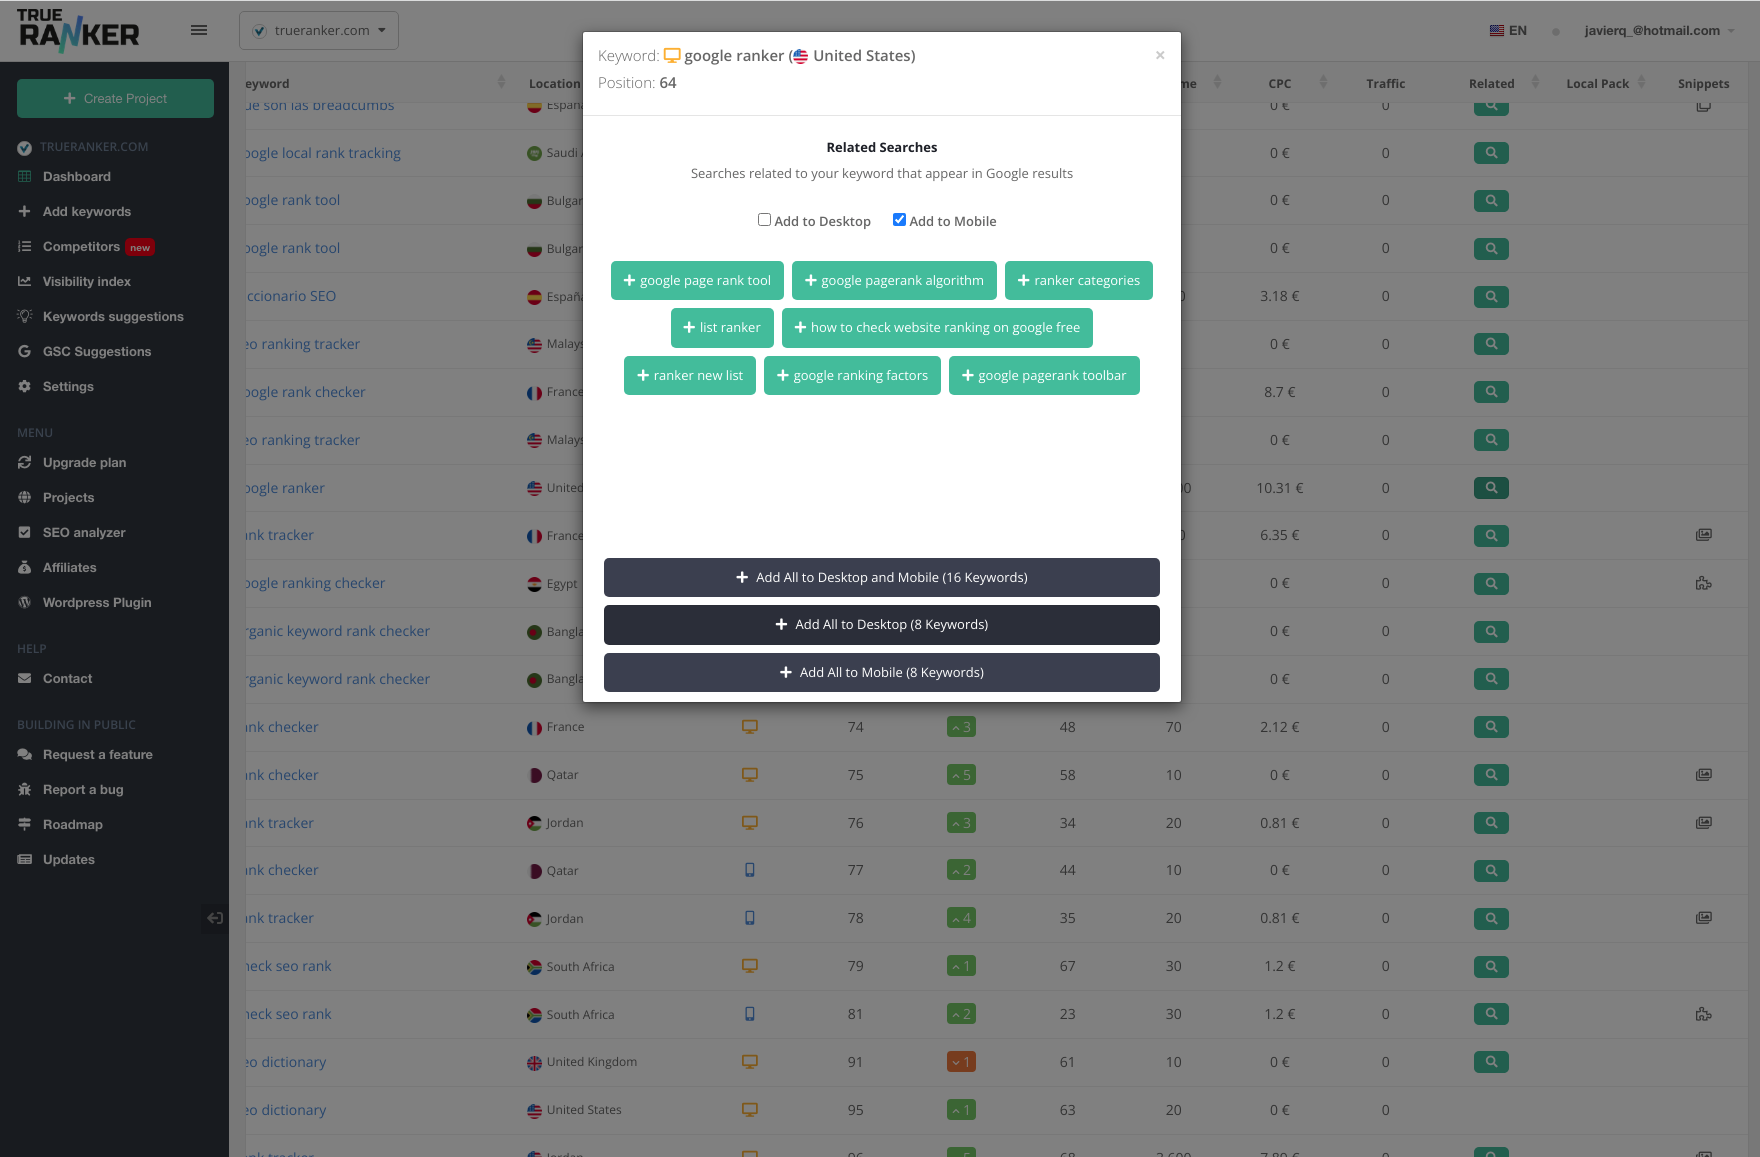
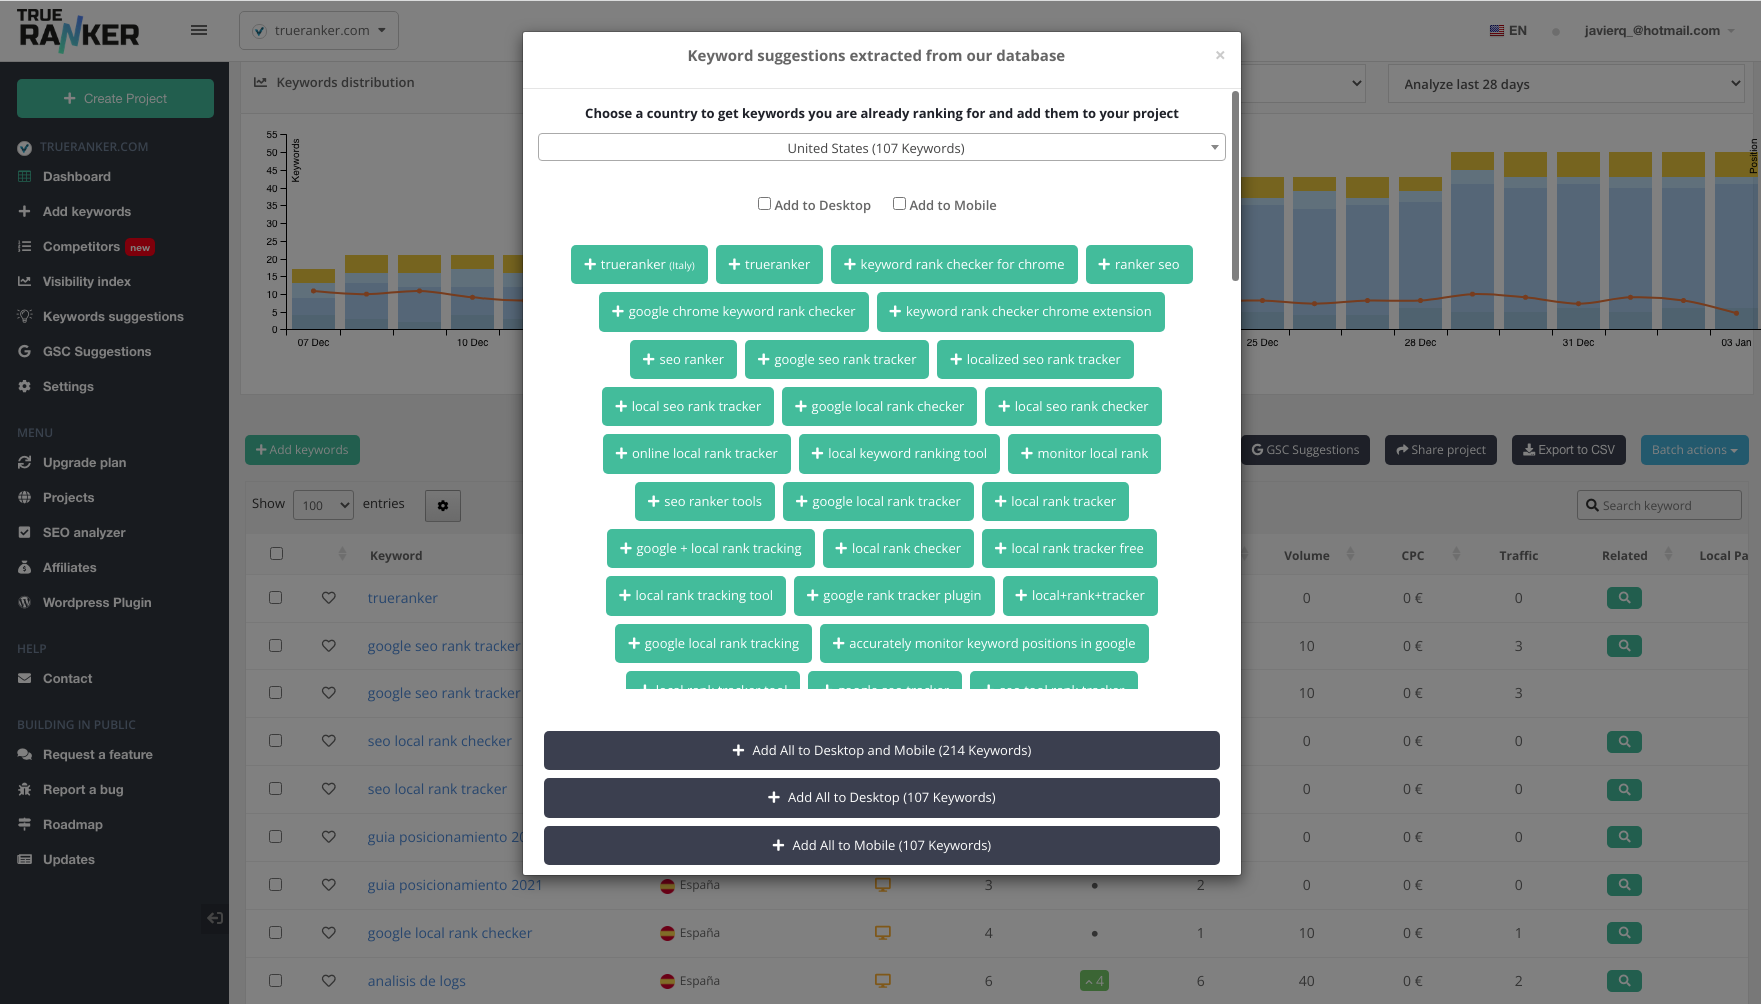
We understand that Keyword Suggestion was difficult to use. There was not a relevant sorting and it was troublesome to add keywords from that screen. As usual, we took your feedback.
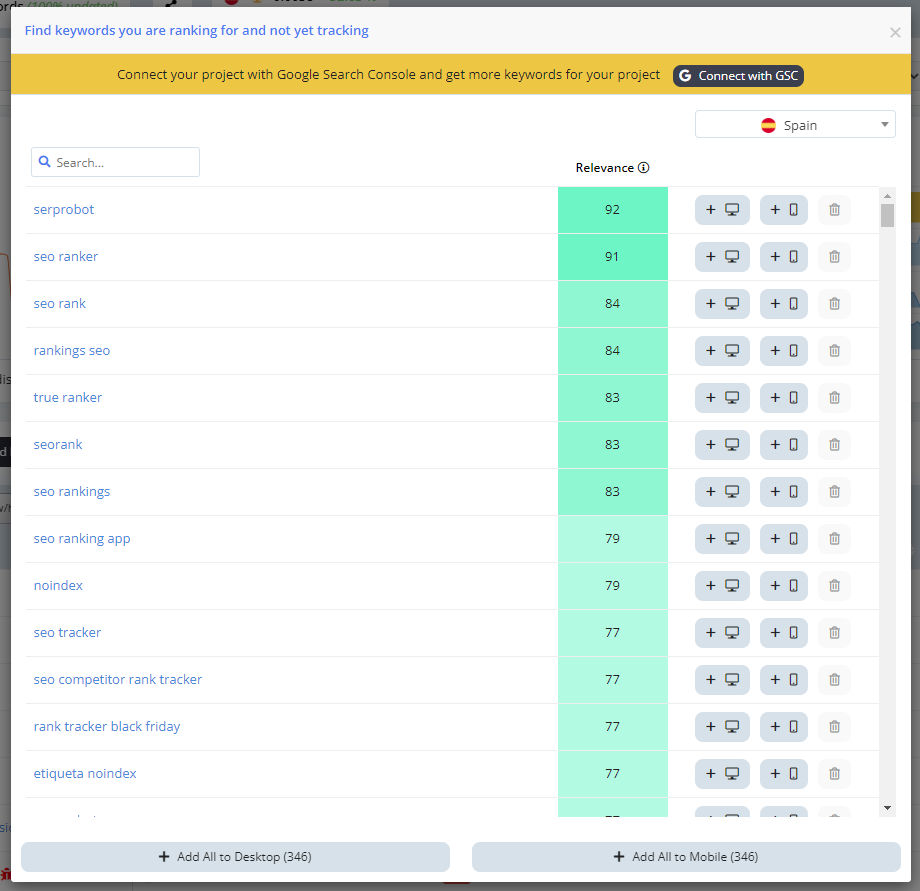
Now it is easier than ever to find new keywords for your project. We created a Relevance metric to sort the metrics by their importance to add to your project in the majority of cases. By considering metrics like Position, Volume, Impressions, and Clicks, Relevance ensures that users can prioritize their efforts effectively. Higher is better and they are formatted conditionally with shades of greens making it quick and intuitive for users to assess keyword importance.
Connect your Google Search Console to obtain more keywords suggested for your project. That would also improve the relevance with Clicks and Impressions data.
Some keywords are not semantically relevant to your project? even though their Relevance appears as high? We want to allow you to decide which ones are important for your project. Discard them and they won't appear next time.
Now you can close (again) the keywords detail pop up by clicking outside of the box, and even pressing the ESC key in your keyboard. Work faster, not harder!
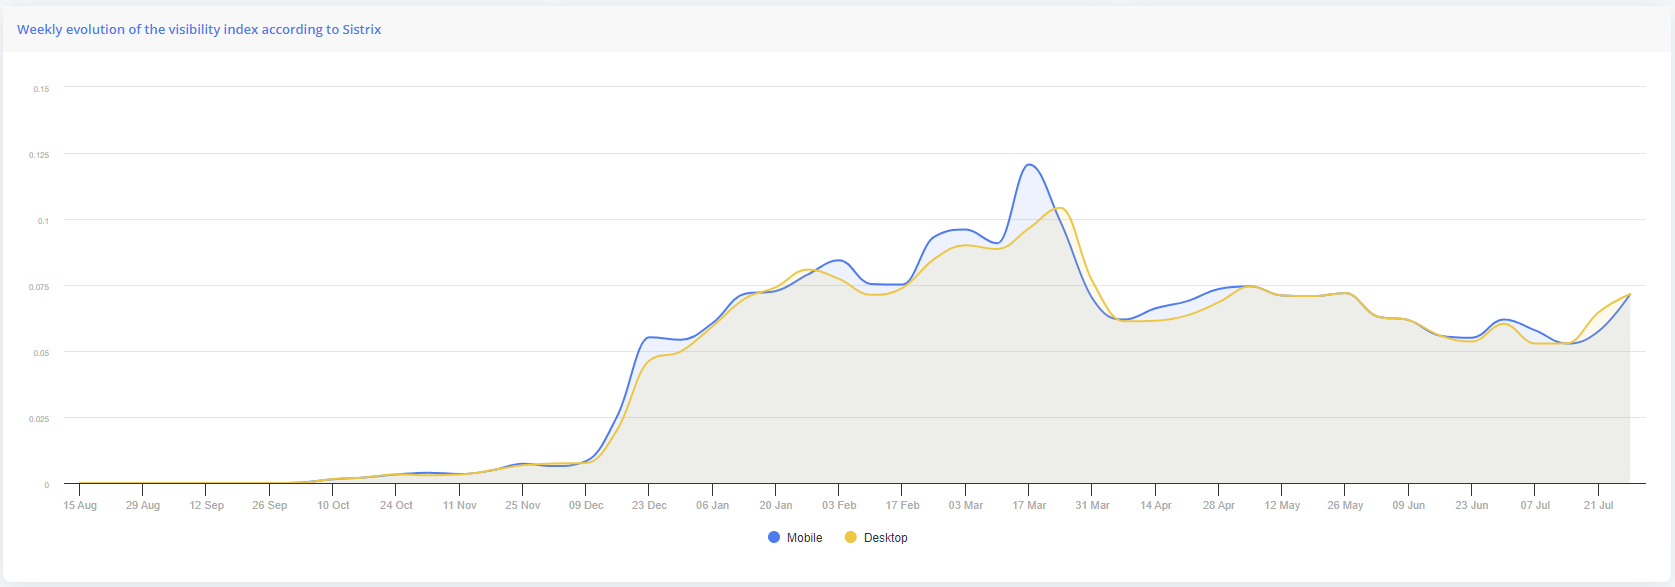
This metric estimates the organic visibility progress for the set of keywords you currently track.
The percentage of organic visibility is calculated by assigning a weight to each SERP position, taking into account the estimated CTR. In no case is the search volume considered.
If your project ranks first for all tracked keywords, this metric will be 100 %
We are using the Visibility Index from Sistrix and thus we depend on the countries they have added into their system. They have added recently a few more countries and now TrueRanker users can also consult these.
Chile 🇨🇱 Cyprus 🇨🇾 Egypt 🇪🇬 Malaysia 🇲🇱 New Zealand 🇳🇿 Nigeria 🇳🇬 Ukraine 🇺🇦 United Arab Emirates 🇦🇪 Pakistan 🇵🇰 Philippines 🇵🇭 Singapore 🇸🇬
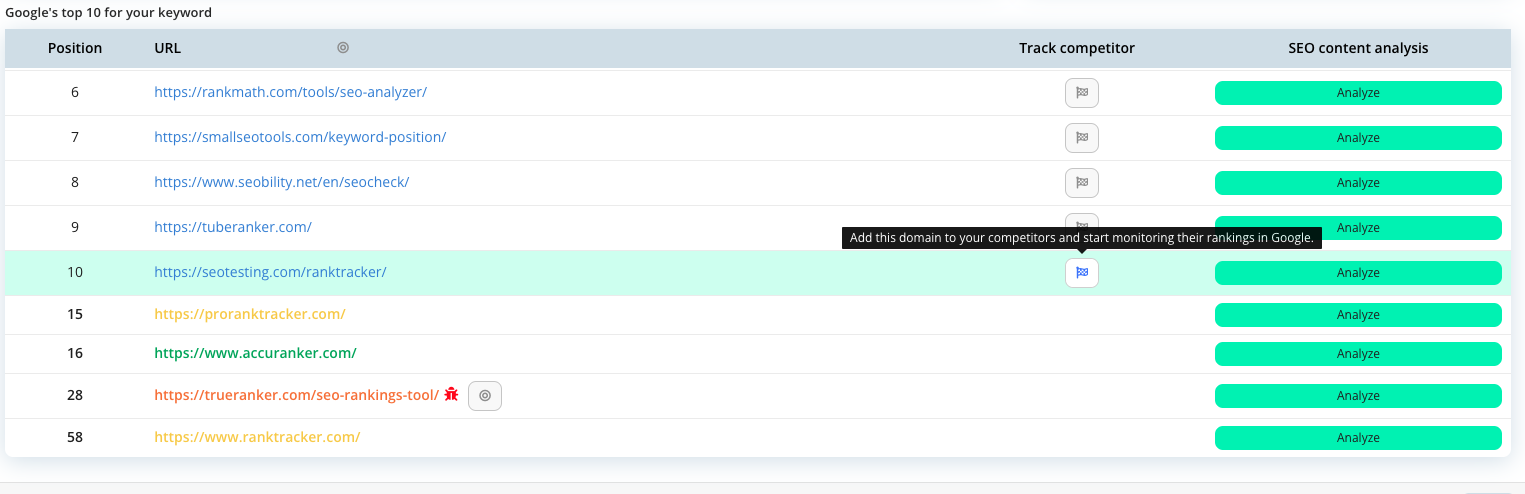
Less clicking and less typing = more time for other tasks. Now you can add easily competitors with one click from the top 10 URLS ranking for your keywords. Everyday trying to make TrueRanker easier to use!
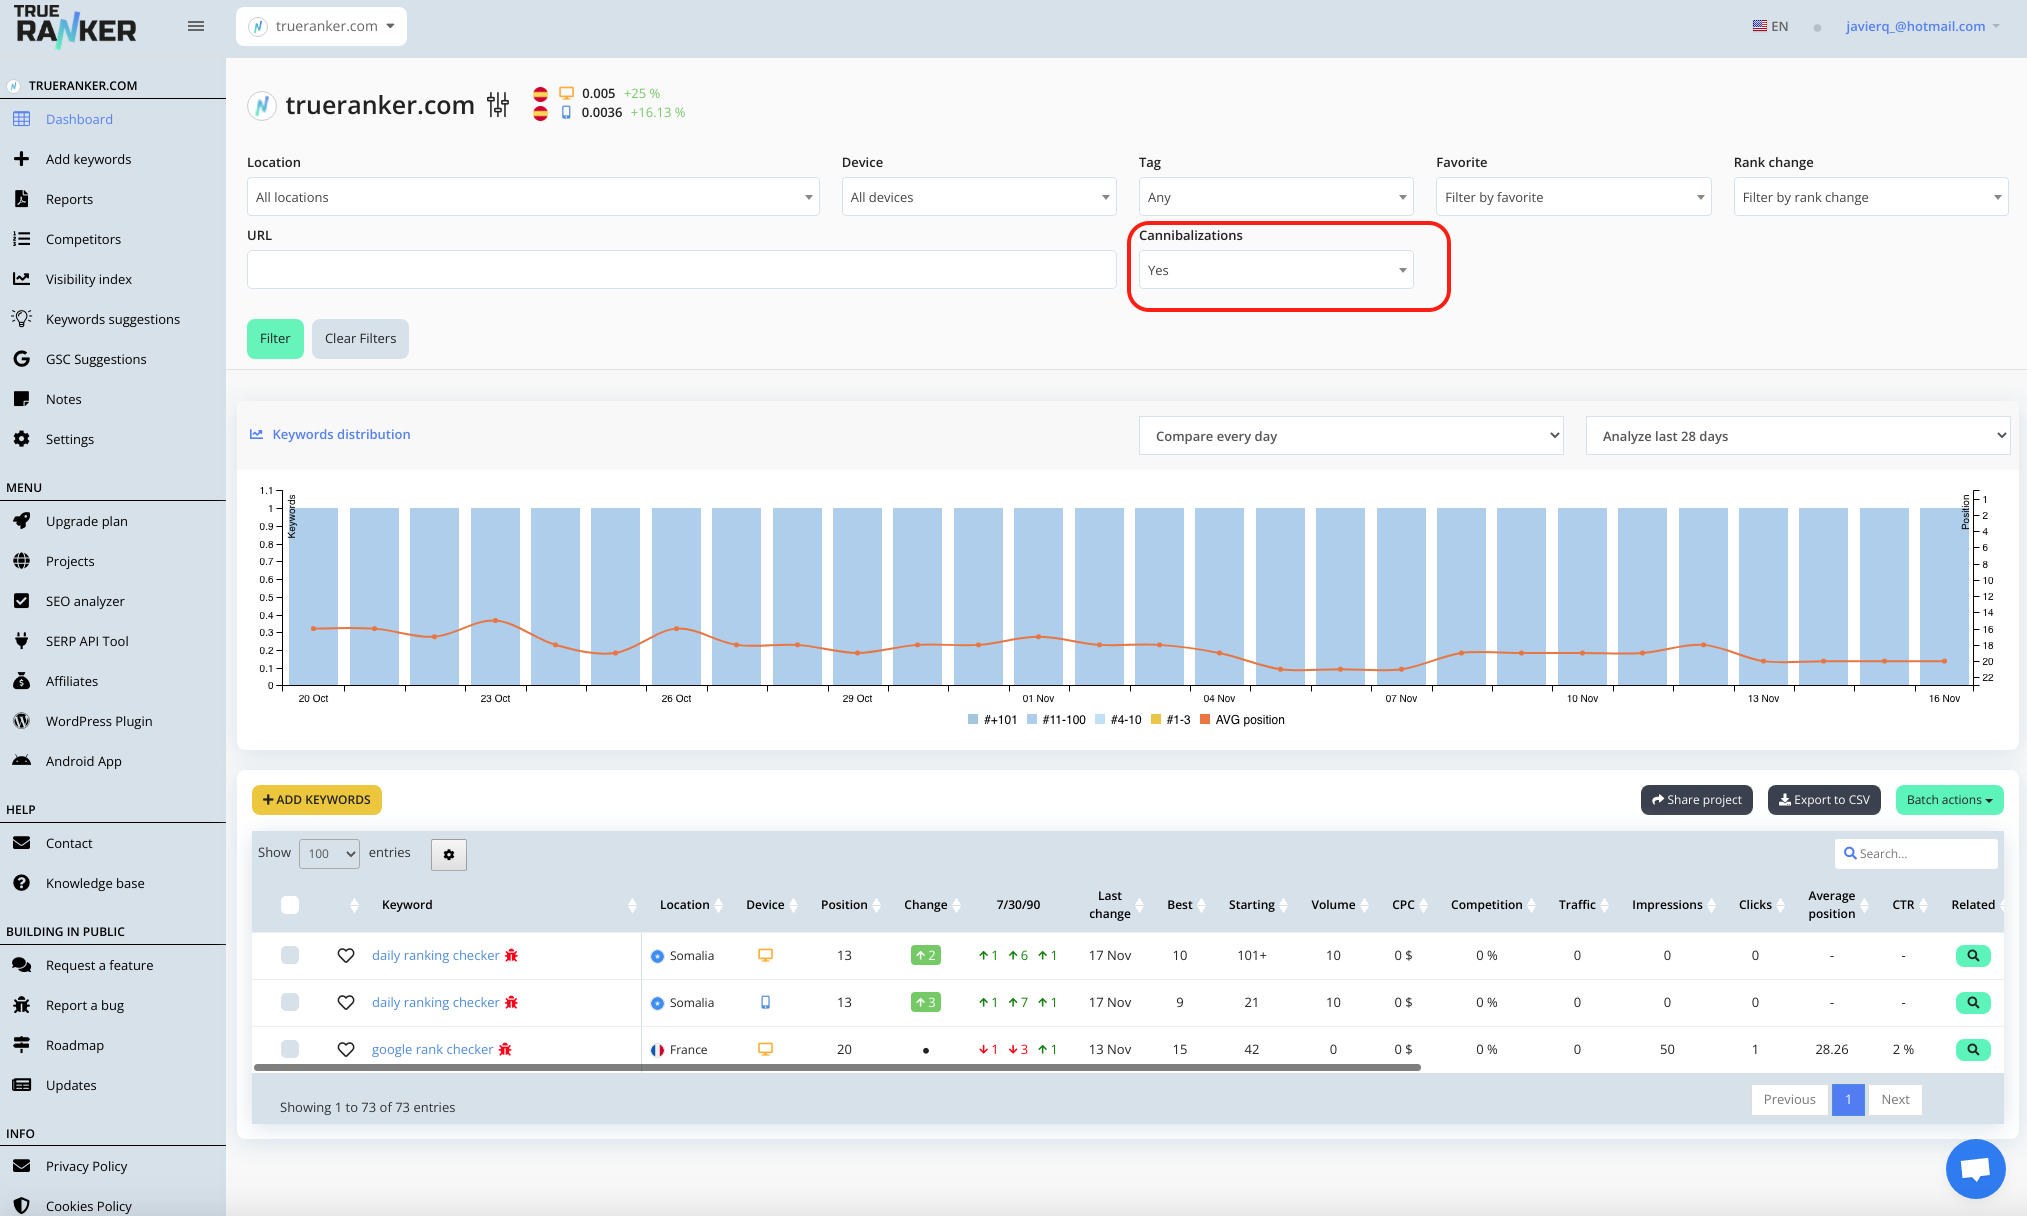
More filter options for Cannibalizations. With the addition of Target URL, now you can see different states of cannibalizations. With the help of the filter, you can now see at a glance which keywords are cannibalized by different URLs, either with or without Target URL.
Help yourself to use the filters to add Target URLs in batch as well.
Following on the current efforts of the TargetURL and Cannibalizations features, you now have the power to assign multiple keywords from a sort/filter to a specific target URL in a matter of seconds. No more tedious manual allocation for each keyword . We understand how important it is to streamline your SEO efforts, and this new feature is designed to do just that.
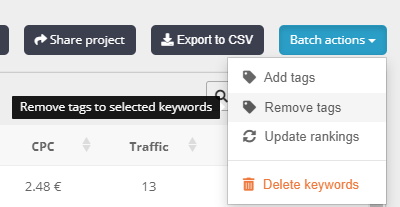
Just select the desired keywords, and from the Batch Actions dropdown select Add Target URL and introduce your intended ranking URL for these keywords. Easily add target URLs to your keywords so you can have more information about cannibalizations.
With the addition of the TargetURL feature, now there are 4 possible states that cannibalization may display on each of your keyword.
No icon. There is no cannibalization
Red bug icon. You have more than 1 URL ranking for the keyword. And if you have set up targetURL for this keyword, the URL ranking higher is not your target URL.
Blue bug icon. You have more than 1 URL ranking for the keyword, but the higher ranking is your target URL.
Blue bullseye icon. You have your Target URL ranking and there is no cannibalization.
Have you ever wished that you didn't have to set the location every time you add new keywords? We heard you! With our latest update, we are have set the project country as the Default location when adding keywords. Now, you can save time and focus on what matters most – optimizing your website's search rankings.
Moreover, when you are using the filters and find out these keywords that you are missing in your project, TrueRanker helps you selecting the filtered location as the default location when adding keywords. Others filter like tags, device, etc. apply as well. Simplicity and efficiency.
Short-tail keywords may be popular, but they can also be highly competitive. That's why it's crucial to start from the right foot and prioritize the keywords that give you a better chance of ranking higher in search results. Our new filtering feature allows you to do just that, putting you in control of your SEO strategy
Now you can filter by the keyword length in your dashboard
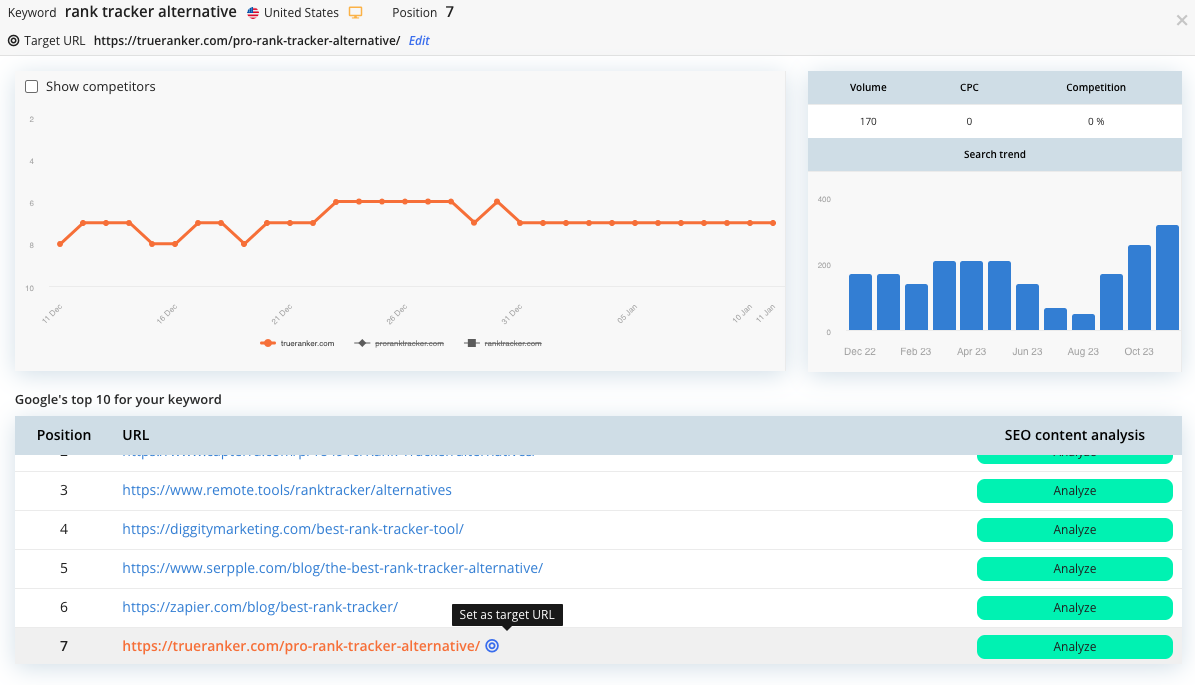
With the new Target URL feature, you now have the freedom to add a desired URL that may differ from the ranking URL. This means you can monitor the position of your keywords for a specific page, even if it's not the same page where the keyword is currently ranking. The cannibalization icon 🐞 will now also tell you when the you are not ranking for your desired URL.
In the current iteration you can set up the Target URL only from the keyword detail page. In the keywords table, click on the keyword and you will find the target URL at the top. If you are already ranking for a URL, you can also set it as Target URL with one click.
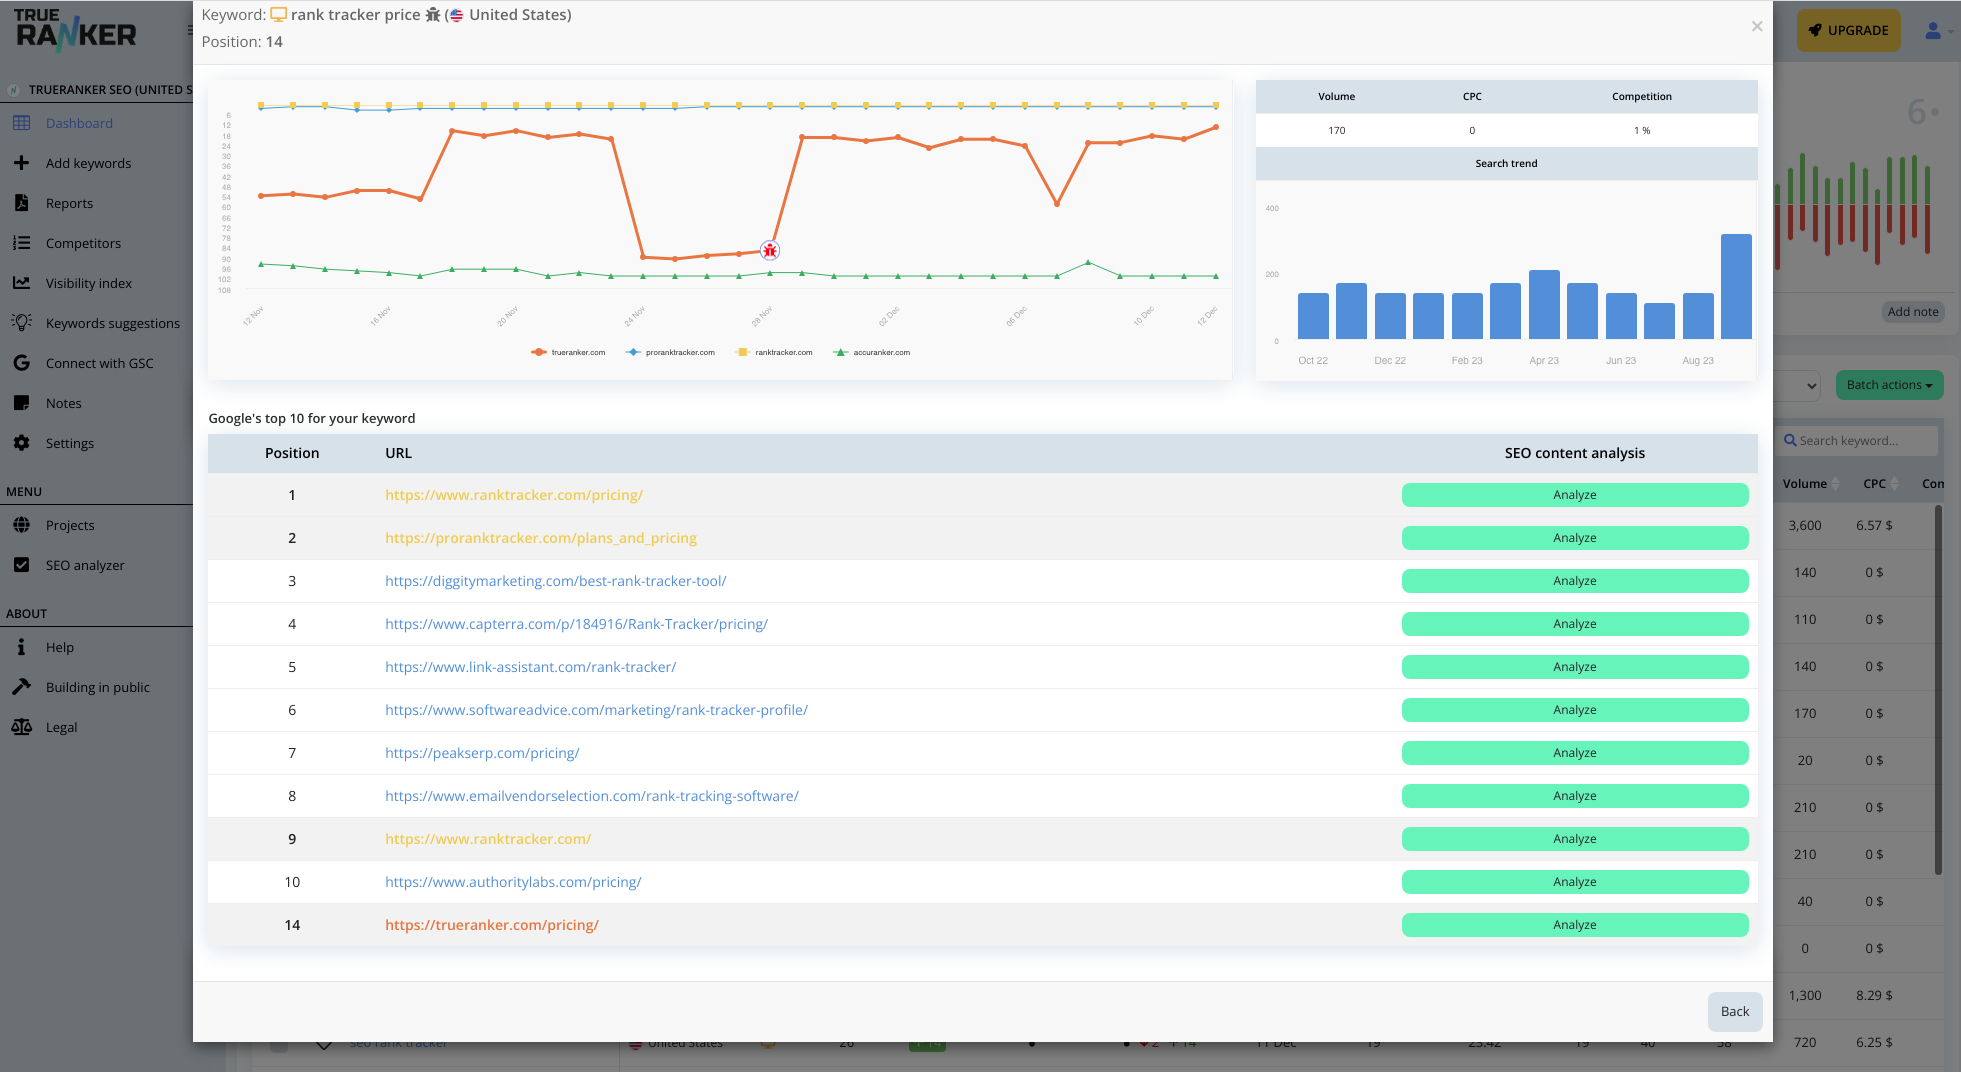
Competitor Analysis Added to Keyword Popup on Dashboard
Hey TrueRankers!
We are thrilled to announce the latest update to our SEO Rank Tracker: the ability to check your competitors right from the dashboard keyword popup! Now, you can easily track your keyword positions and keep an eye on your competition, all in one place.
On top of that, now the urls of your competitors are coloured in the same colour as in the graph for an even easier way to see them. Don't forget to add your competitors!
If a custom default time period had been saved in the project date picker, when loading a project that had no data in that period it could give an error.
There were certain cases where the grouped views did not correctly display the order of the column headers, resulting in data being displayed in the wrong fields.
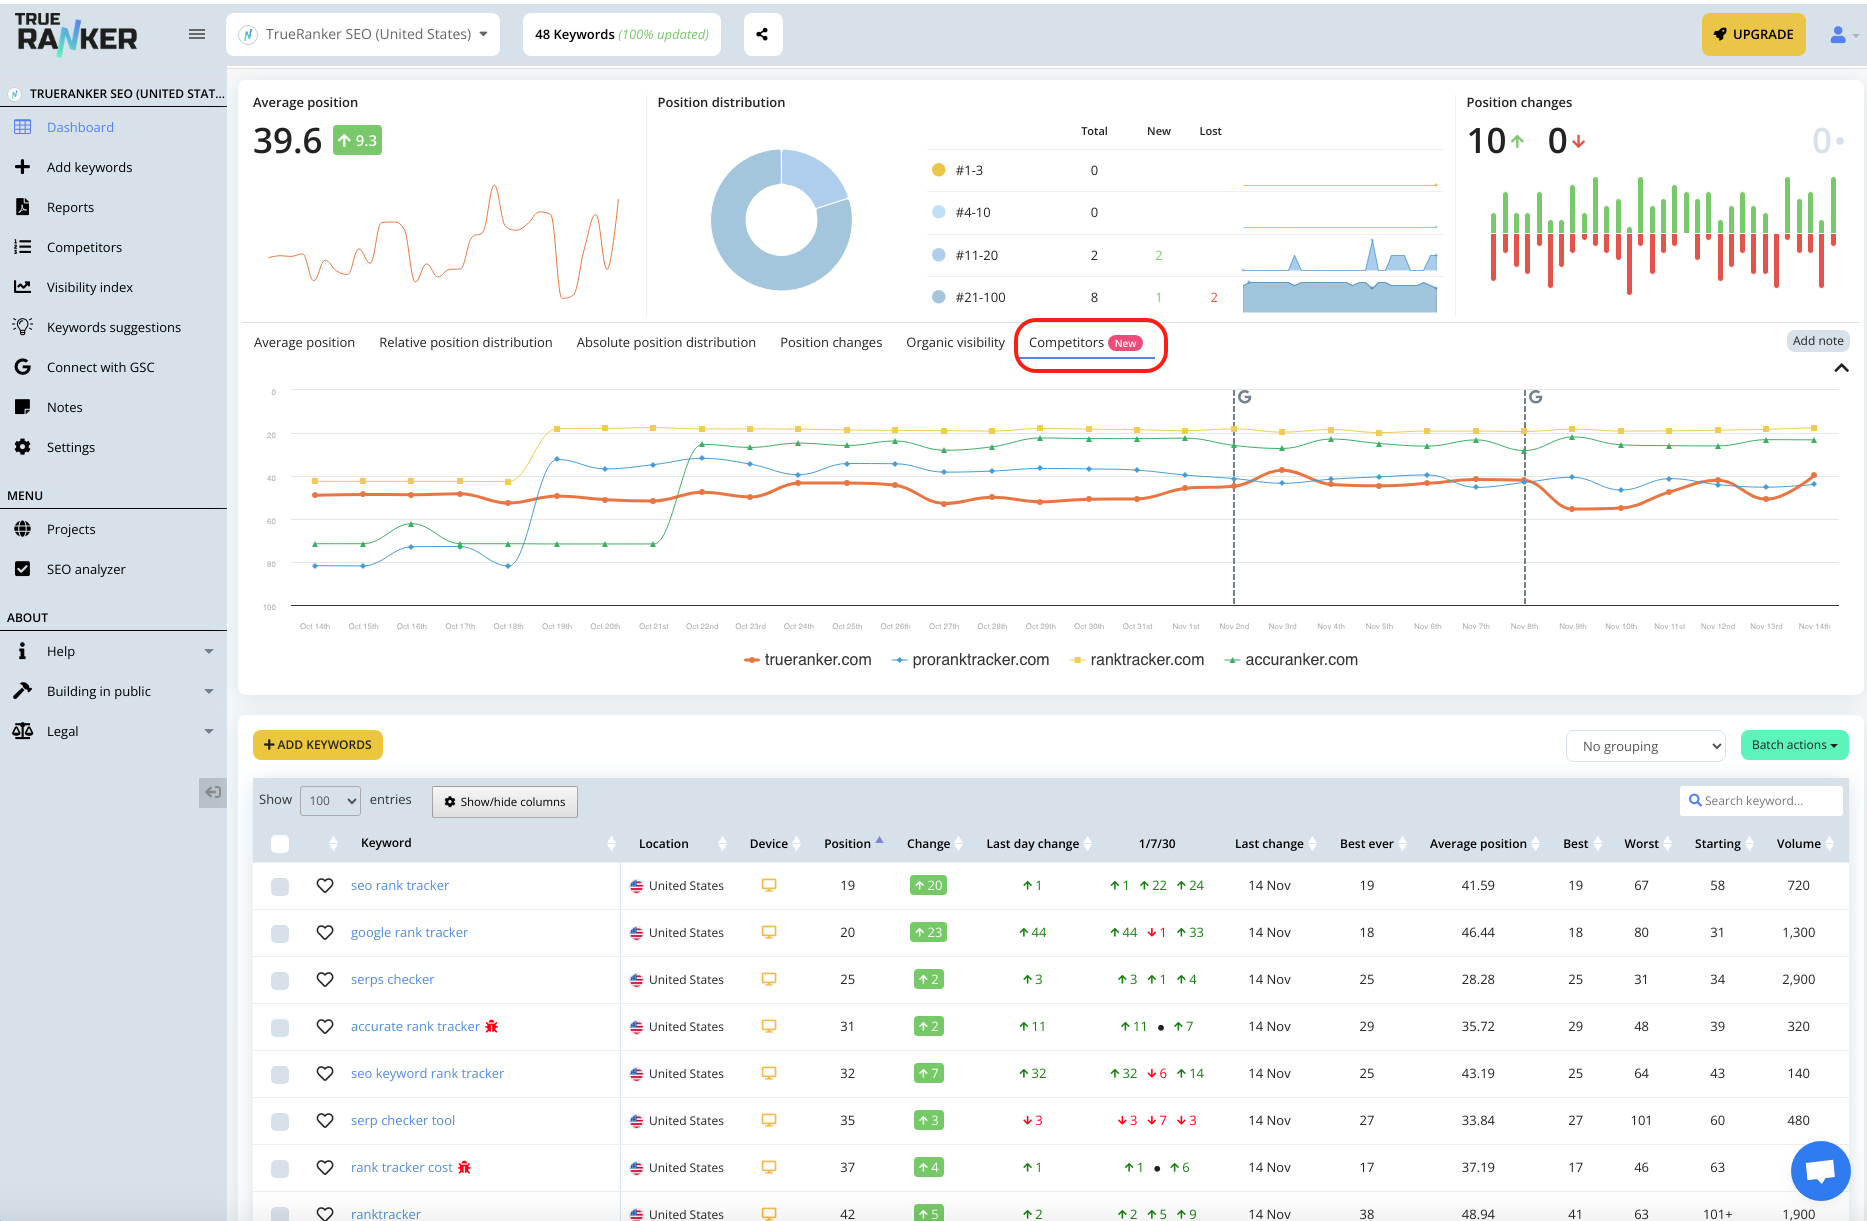
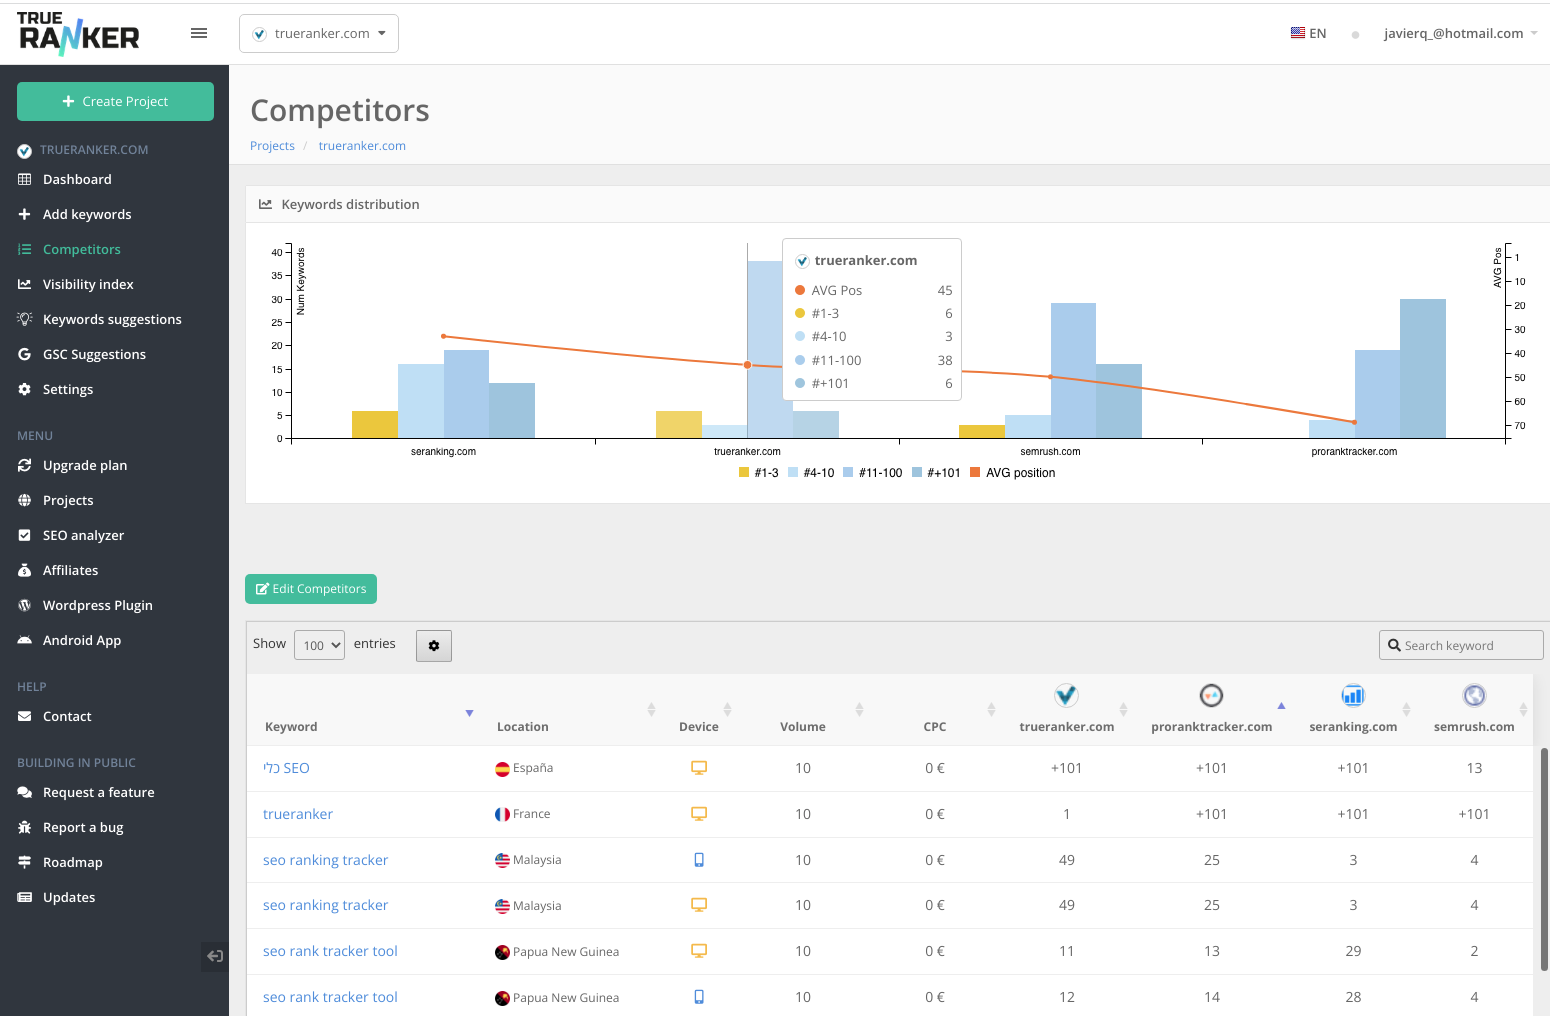
We have added the graph of the evolution of the average position of competitors in the project Dashboard.
With this we make it possible for you to access this graph without having to switch screens. If you want to go deeper into this data, you can work on the competitors screen.Competitor chart in the Project Dashboard
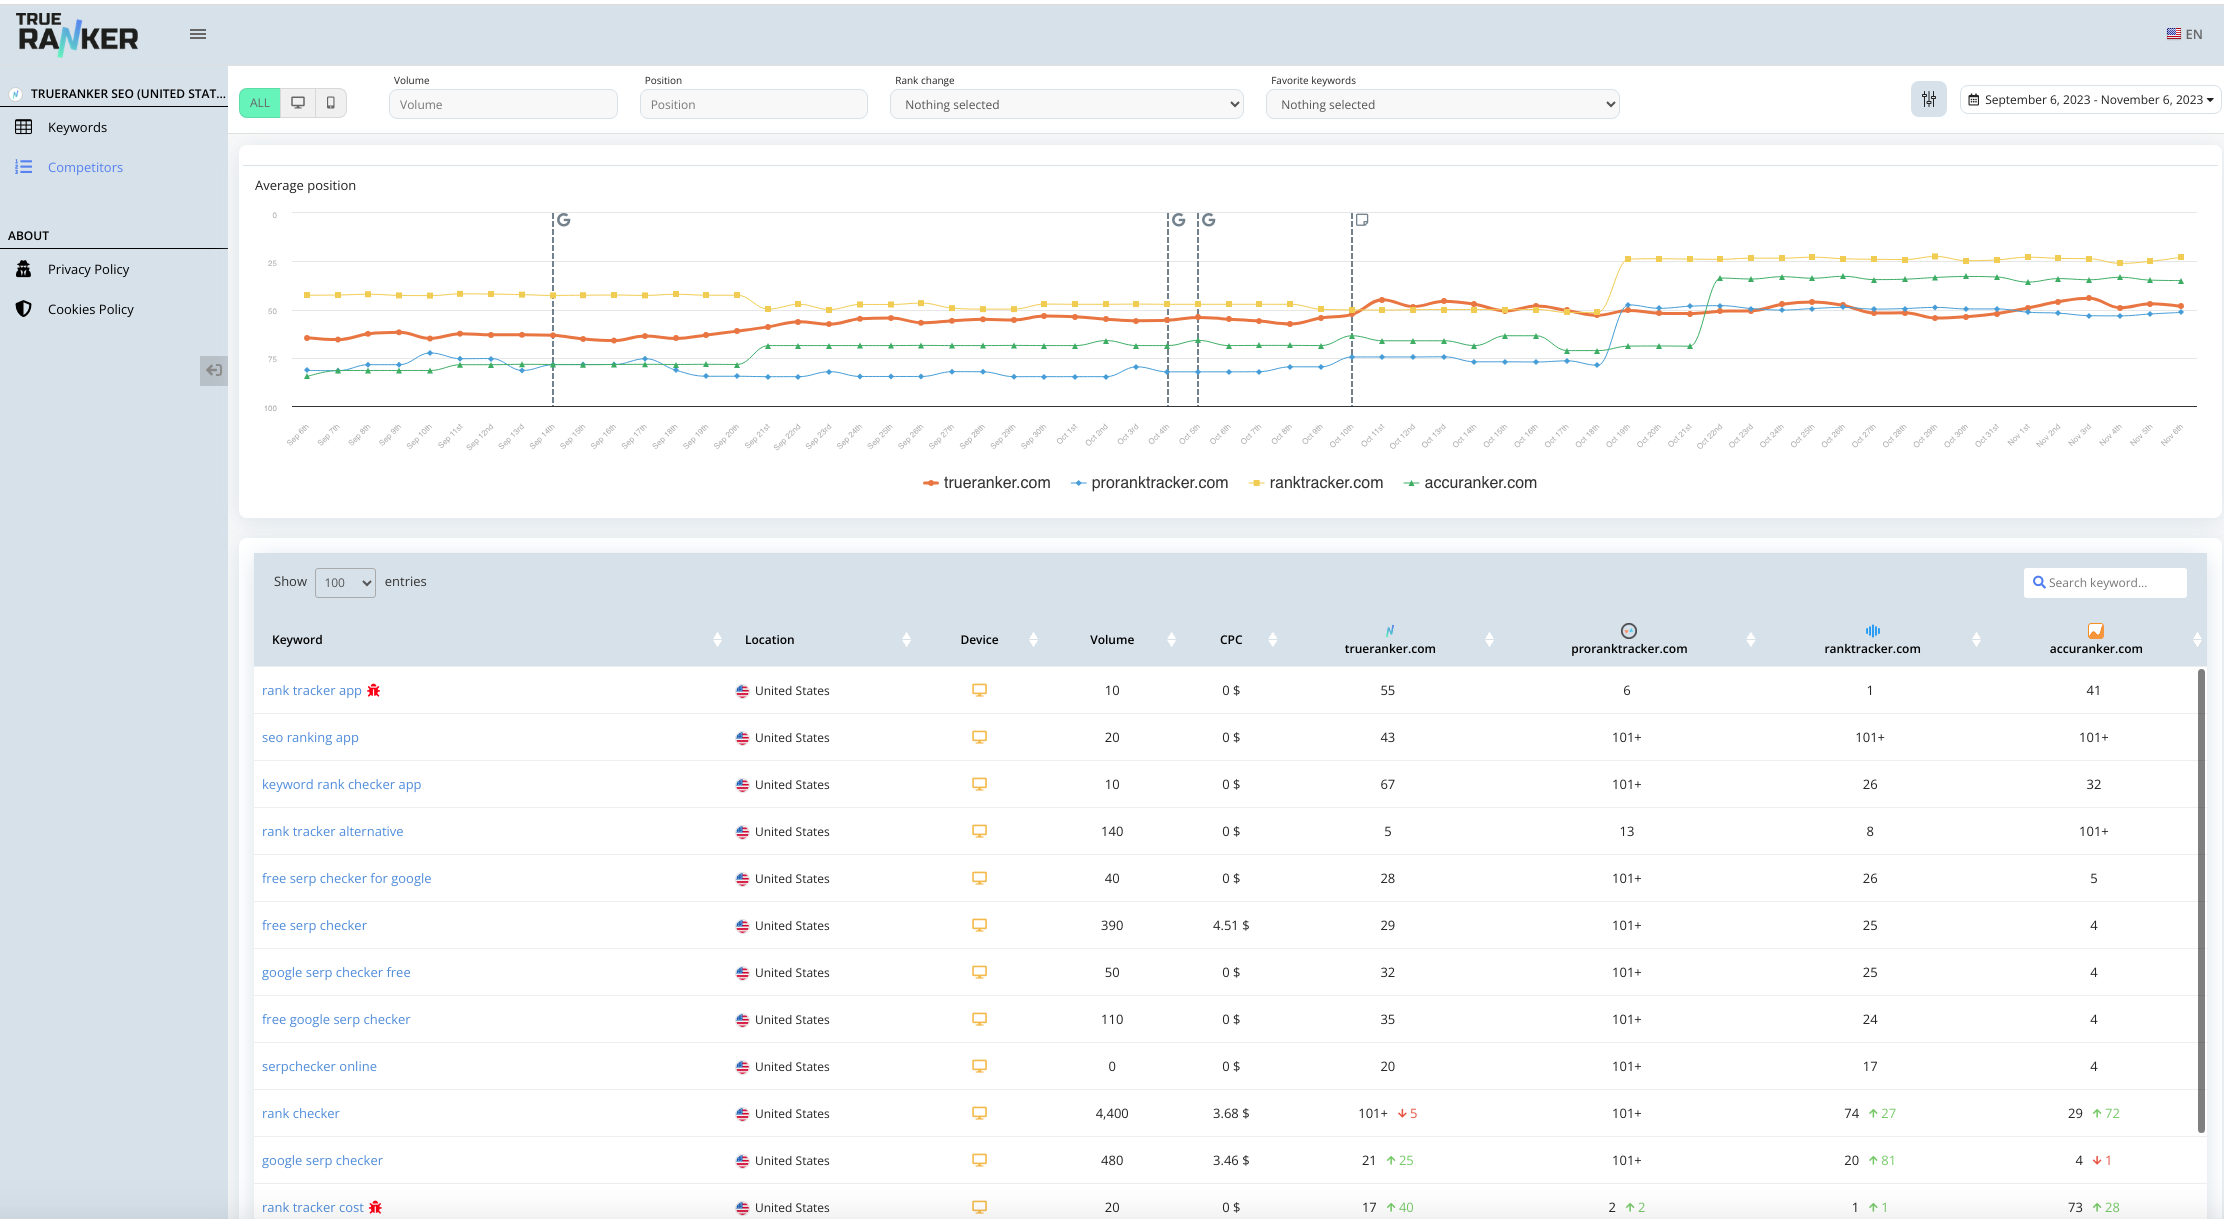
We have adapted the competitors' screen to the same style as the project Dashboard. We have added the following functions:
✅ Select positions and compare by date ✅ We have added new filters (the same as in the Dashboard). ✅ We have added a graph with the evolution of the average position of your project and those of your competitors. ✅ We improved the position history graph for each keyword.
During the next weeks, we will continue working on this new view to add new graphs and offer more data to help you have a better perspective of the competition of your projects 💪🚀New competitors view
The button to update keywords has been removed, both the batch action and the button in the "actions" column.
Since a few months ago when the user logs in, it automatically prioritizes his keywords (https://feedback.trueranker.com/updates/update-keywords-when-logging-in), which is exactly what this button did.
The new organic visibility chart is now available on the project page.
This metric estimates the organic visibility trend of your project for the set of keywords you currently track.
The percentage of organic visibility is calculated by assigning a weight to each SERP position, taking into account the estimated CTR. In no case is the search volume considered.
If your project ranks first for all tracked keywords, this metric will be 100 %.
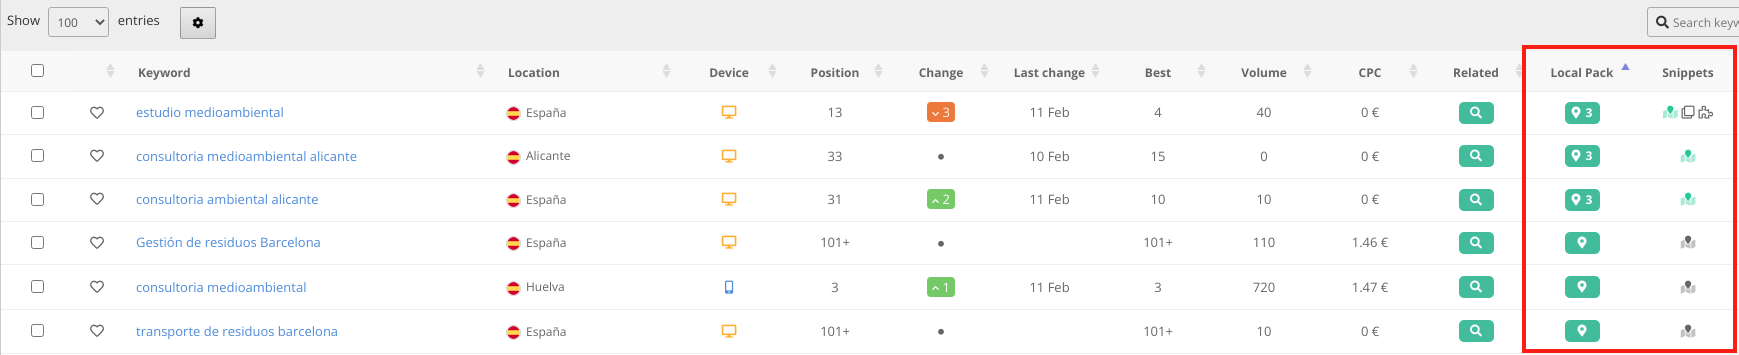
When a date previous to today was selected in a project, the local pack and snippets columns were shown empty, as this data is only stored for the most recent crawl.
Now, in this case, the data is still displayed, but a warning appears next to it to notify you of this fact.
We have added more column options to see the average, best and worst position in the selected period.
By default, these new columns are hidden and you will have to enable them yourself, in case they are useful to you, from the table settings.
Due to these changes, it is necessary to reset the table configuration (order, visibility of columns...), so you will have to restore it to your liking if you have changed it.
Now when you change the date range in the date picker, the dates will be saved in your browser session.
This means that when you change to another project in the same work session the dates will be kept, avoiding having to change to the desired period each time you view one (especially tedious if you have many projects).
However, if, for example, you come back the next day, the system will revert to showing 1 month by default.
Any feedback you may have is appreciated: https://feedback.trueranker.com/boards/feature-requests/posts/save-selected-period-in-project-dashboard
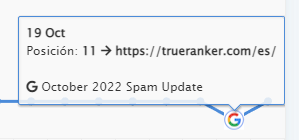
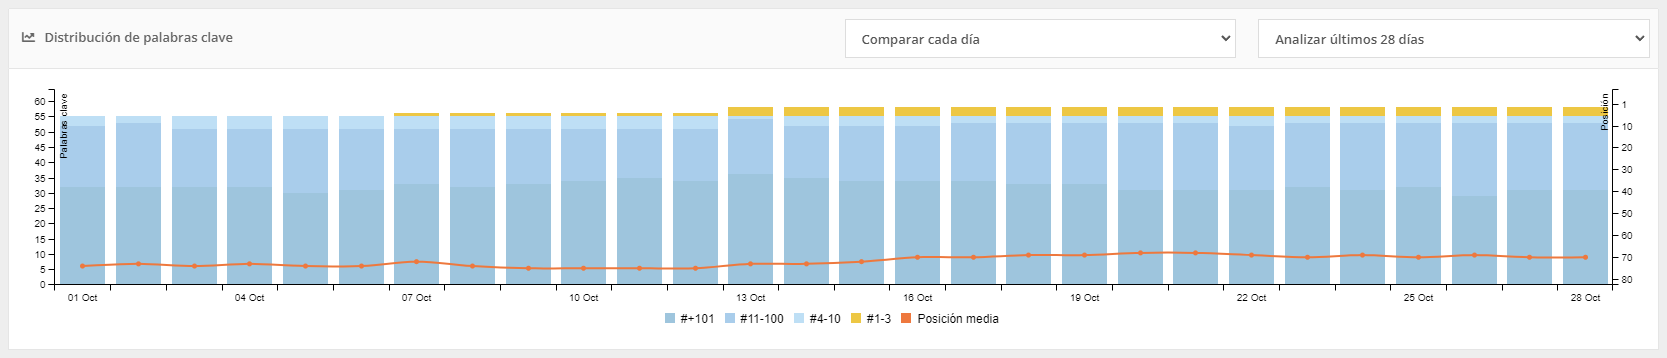
We're excited to announce a new feature that will take your keyword analysis to the next level. With our latest update, you can now add notes to your keyword distribution chart. This means that you can easily keep track of any actions taken and see if they correlate with any ranking movements.
The notes feature is not new, but now it's even more useful. It's no longer just for recording a remark, but it's a powerful tool to help you analyze your ranking movements. By adding notes to your keyword distribution chart, you can see at a glance which actions had an impact on your rankings, and which didn't.
We're always striving to improve the user experience, and this feature is a great example of that. We know that keeping track of all your actions can be a daunting task, especially when you're trying to optimize your ranking. With the new notes feature, all your actions are easily accessible on the keyword distribution chart.
So, what are you waiting for? Start adding notes to your keyword distribution chart today and see the impact it has on your rankings. As always, we appreciate your feedback. If you have any comments or suggestions, please let us know. We're here to help you succeed!
Hey TrueRankers! We're excited to announce our latest update that will make tracking your keyword progress even easier. As a user who adds keywords to track your website's search engine rankings, you can now filter and sort them by the date they were added to your project.
With this new feature, you can easily keep track of the progress of your keywords from the day you added them to your project, without being affected by the overall rankings. This way, you can focus on the keywords that are showing progress and adjust your strategy accordingly.
At TrueRanker, we're committed to providing you with the best tools to optimize your SEO efforts. We believe that this new feature will help you to gain more insights into your keyword performance and make data-driven decisions that will improve your website's search engine rankings.
We're always looking for ways to improve our product and make it more user-friendly. If you have any feedback or suggestions on how we can make TrueRanker even better, please let us know. We love hearing from our users and value your input.
Introducing Extended Analysis Period for Keyword Distribution Chart on TrueRanker!
Hey there, TrueRanker users! We are excited to announce our latest update to the product that we know you'll love. We have listened to your feedback and worked hard to implement the latest feature that will take your keyword tracking to the next level.
Starting today, you can enjoy a longer analysis period of up to 12 months (or more, if possible) for your keyword distribution charts. We understand how important it is to have a long-term view of your keyword performance, and we want to make sure that you have the tools to make informed decisions.
We are confident that this new feature will help you gain deeper insights into your keyword performance and provide you with a better understanding of your overall SEO strategy. Whether you're a seasoned SEO expert or just starting out, this new update is sure to be a game-changer for you.
Thank you for choosing TrueRanker as your go-to SEO tool. We are committed to providing you with the best product possible, and we can't wait to see the results you achieve with this new feature. Keep ranking!
Introducing TrueRanker's Tag Dashboard: A Comprehensive View of Tag Rankings and Assigned Keywords
At TrueRanker, we’re always working hard to improve our products and provide you with the best possible experience. That’s why we’re excited to announce the latest addition to our suite of SEO tools: the Tag Dashboard!
With the Tag Dashboard, you can now see an overview of the combined ranking of each tag, giving you a quick and easy way to assess the performance of your keywords. And if you want to dive deeper, you can simply click on a tag to see the specific keywords assigned to it.
We know that managing your SEO can be a daunting task, but with the Tag Dashboard, we’re making it easier than ever. You can now keep track of all your tags and keywords in one convenient location, so you can focus on what really matters: improving your search engine rankings.
So what are you waiting for? Head over to TrueRanker and try out the Tag Dashboard for yourself. We’re confident that it will quickly become an indispensable part of your SEO toolkit.
Inverted Keyword Distribution Order for Better Efficiency
Hey there TrueRankers! We're excited to announce a brand new update to our product that will make your keyword analysis even more efficient. We've implemented a new feature that allows you to invert the keyword distribution order in our graphic, making it easier to see the keyword increase that really matters to you.
We know that analyzing your keyword data can be a time-consuming task, and we're always looking for ways to make the process smoother and more effective. With this new feature, you can now quickly and easily identify the most important changes in your keyword rankings.
Here at TrueRanker, we're committed to providing you with the tools you need to succeed in your SEO efforts. With this latest update, we're confident that you'll be able to take your keyword analysis to the next level.
So what are you waiting for? Log in now to TrueRanker and start using our new feature to optimize your keyword strategy. We'd love to hear your feedback, so please don't hesitate to let us know what you think!
New Feature: Custom Date Range Analysis in TrueRanker
Hello TrueRanker users,
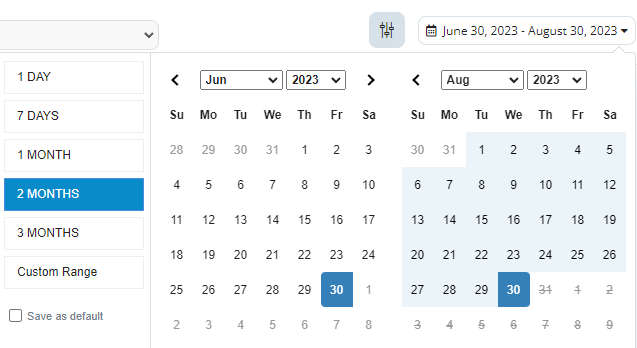
We are thrilled to announce a new feature that will change the way you analyze your rankings. You can now choose a custom date range to check your rankings, giving you greater flexibility and control over your data.
Until now, you could only see your rankings for the last 7 days, 30 days, or 90 days. But we know that sometimes you need to analyze your rankings over a specific period, whether it's a month, a quarter, or a custom range you define. With our new feature, you can do just that.
Simply select the start date and end date for the range you want to analyze, and our system will generate a report that shows you how your rankings have changed over that period. You can use this information to track your progress, compare performance against previous periods, and identify areas for improvement.
Introducing "Filter by Position" for Efficient Keyword Targeting on TrueRanker
Hey TrueRankers! We've got some exciting news for all of you who are looking to step up your keyword game. Our latest update introduces a brand new feature that we know you're going to love: the ability to filter by position FROM and TO!
We know that it can be a real pain to sift through 10+ pages of rankings to find those low-hanging fruit target keywords. That's why we've developed a solution that is both intuitive and user-friendly. Now, with our new filter by position feature, you can easily hone in on those keywords that are ranked on the first page but lower than the top three positions.
With this new feature, you can quickly identify opportunities for improvement, and get ahead of the competition. We're confident that this new addition to TrueRanker will help you to achieve your keyword goals faster and more efficiently than ever before.
So what are you waiting for? Log in to TrueRanker today and start exploring our new filter by position feature. As always, we'd love to hear your feedback, so please don't hesitate to reach out to our team with any thoughts or suggestions you may have.
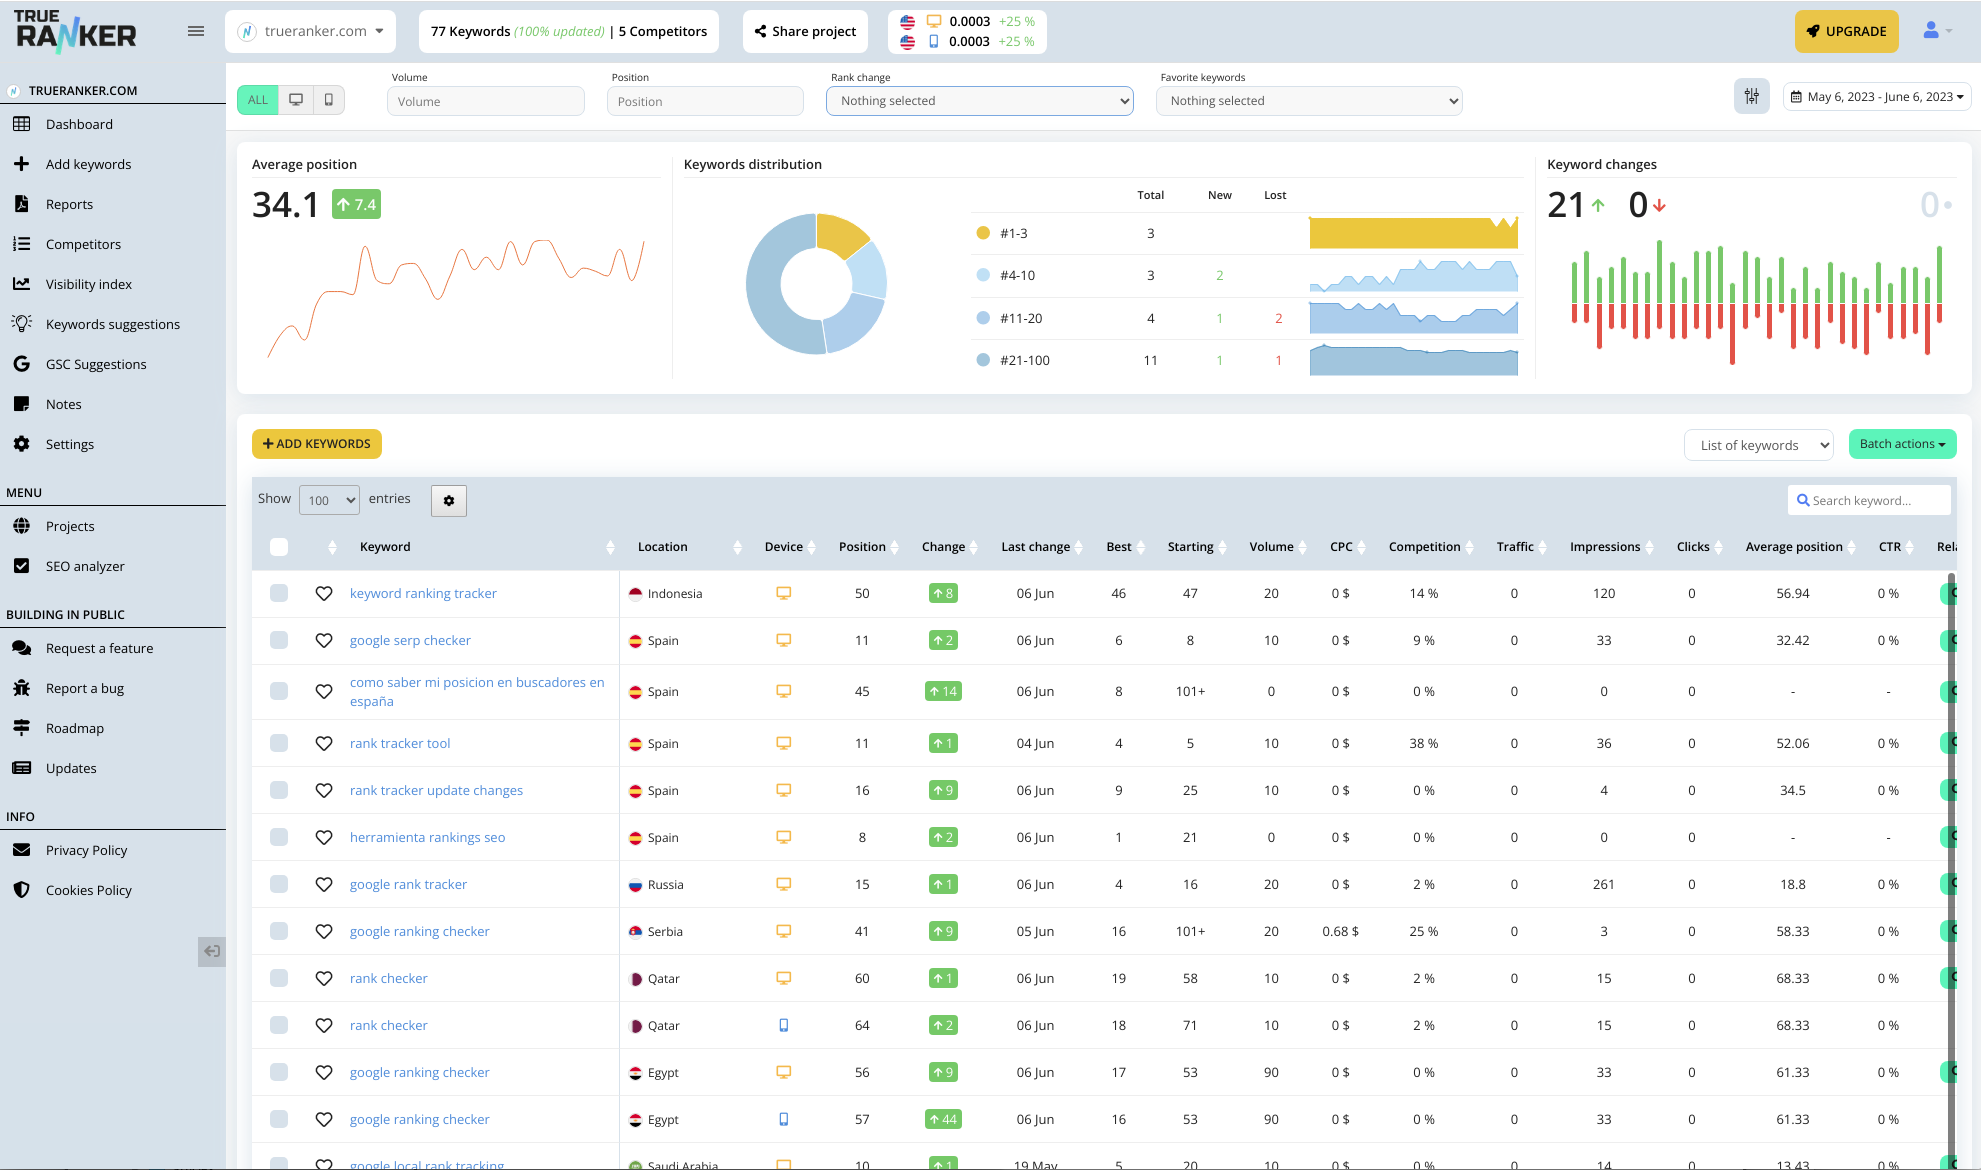
Introducing TrueRanker's New Ranking Summary Section
We’re excited to announce a new feature that will greatly enhance your TrueRanker experience – the Ranking Summary Section! We’ve listened to your feedback and implemented a new feature that will make your daily tracking easier and more efficient.
With the new Ranking Summary Section, you can instantly see the daily update summary of your top keywords, including the top 3, top 10, top 20, and overall top 100. You can also see which keywords are new or lost with just a click of a button. This feature will save you time and simplify your daily tracking, so you can focus on what matters most – optimizing your website’s performance.
Additionally, we’ve added an overall daily summary that shows you which keywords have improved or declined – in bold letters! This will give you a clear picture of your website’s performance and help you make better data-driven decisions.
At TrueRanker, we’re dedicated to providing you with the best tools to help you succeed. We believe the new Ranking Summary Section will greatly enhance your experience and help you achieve your goals. We can’t wait for you to try it out!
Introducing Up/Down/Unchanged Per Project Tracking in TrueRanker
Hey there TrueRankers!
We are excited to announce the latest update to our product that we believe will make a huge impact on your daily workflow. Thanks to your amazing feedback, we have implemented a brand new feature called "Up/Down/Unchanged Per Project".
Now, you can easily track the performance of your keywords on a per-project basis. Our new feature will show you the number of keywords that have gone up, down, or have remained unchanged compared to the last update. This will give you a quick and easy way to know how your rankings are performing and make informed decisions based on the data.
We understand the importance of tracking your keyword performance accurately, which is why we have implemented this feature to make sure you have all the data you need to make informed decisions. With TrueRanker, you can stay on top of your rankings and make sure you are always ahead of the competition.
We hope you enjoy this new feature and, as always, please keep the feedback coming! Our team is committed to making TrueRanker the best product it can be, and we couldn't do it without your support.
TrueRanker is always on the lookout for ways to improve our product and make it more user-friendly. That's why we're excited to announce our latest update – the new summary view for domain ranking!
We received feedback from one of our users that while the graphs for various keyword ranking stats were nice, they found them hard to use and not practical. We listened to their feedback and implemented a simple summary view that provides all the essential information at a glance.
With this new feature, you can now view your domain ranking summary in a single snapshot that highlights your progress and status. This will save you time and effort, allowing you to quickly understand your website's performance and take the necessary steps to improve it.
We hope this new feature makes your TrueRanker experience even better. As always, if you have any feedback or suggestions, please don't hesitate to let us know. We are committed to providing you with the best tools to help you succeed.
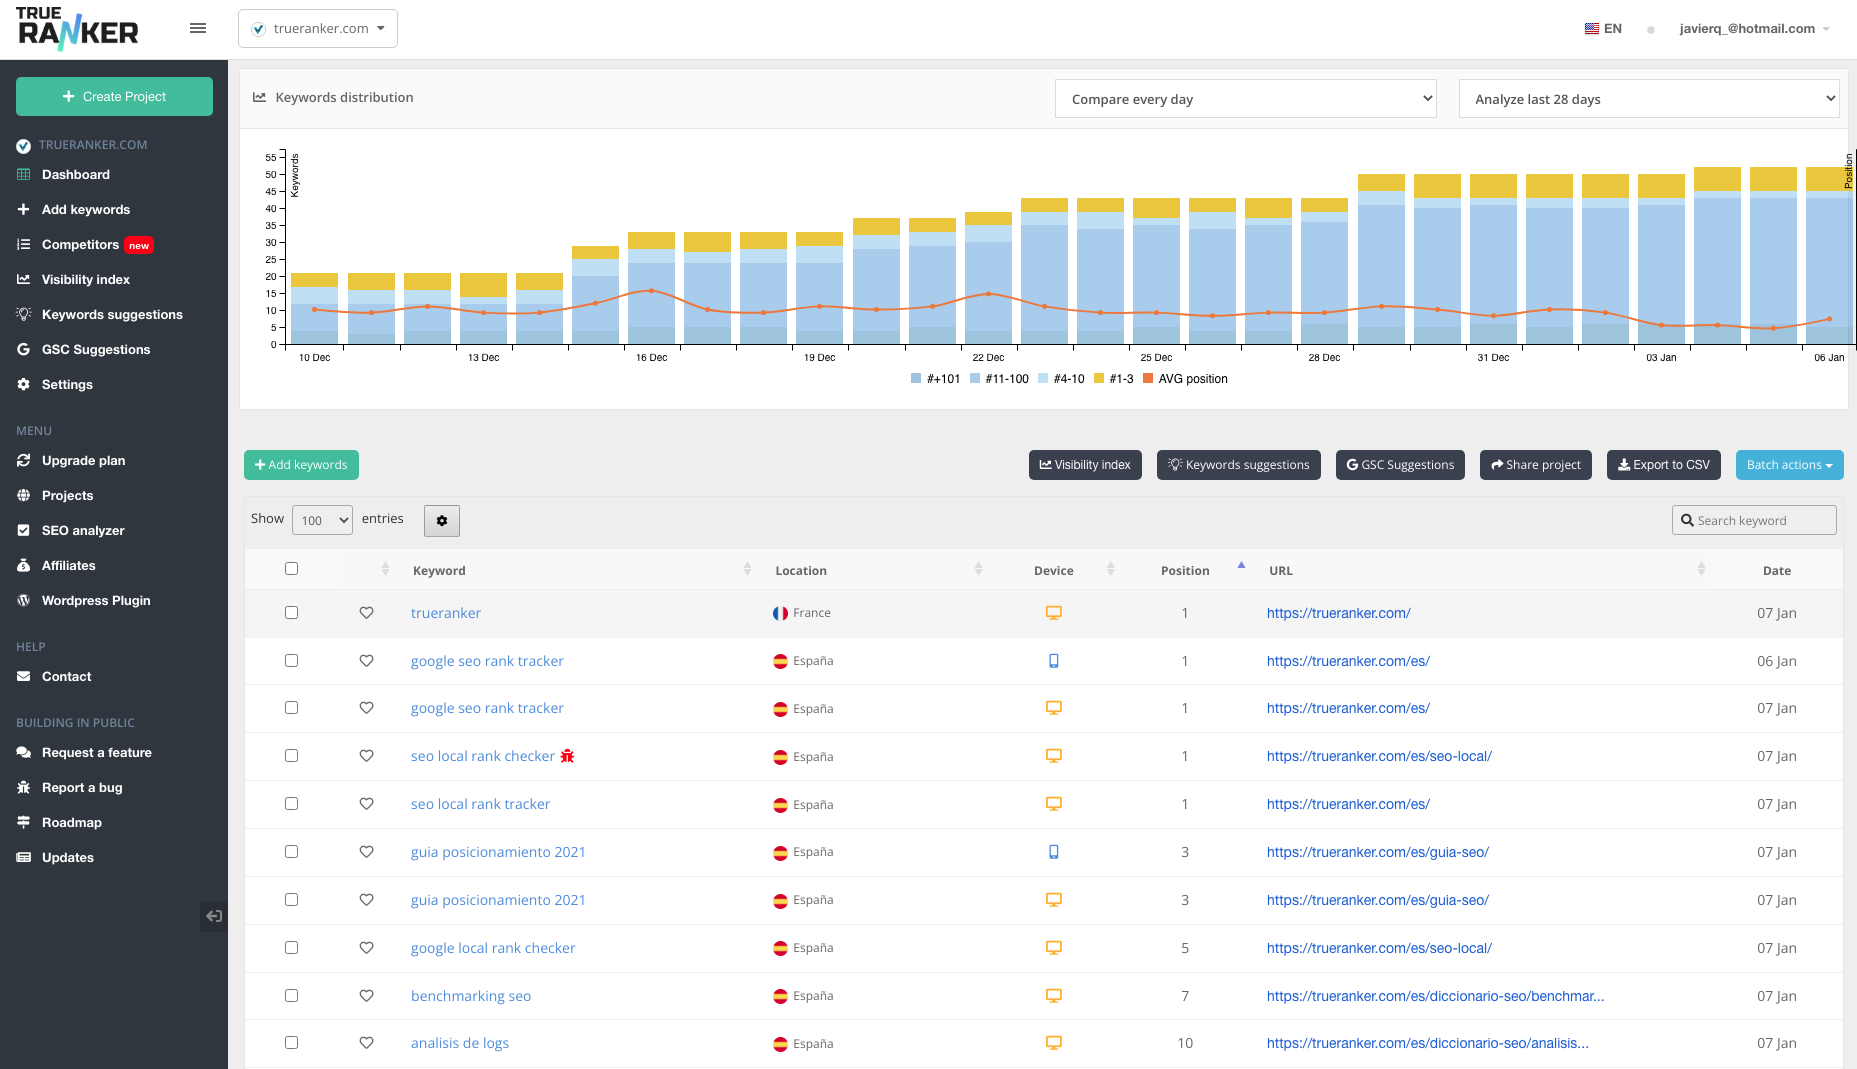
We are excited to announce that our team has been hard at work designing a new dashboard for TrueRanker, and we would love for you to be one of the first to try it out!
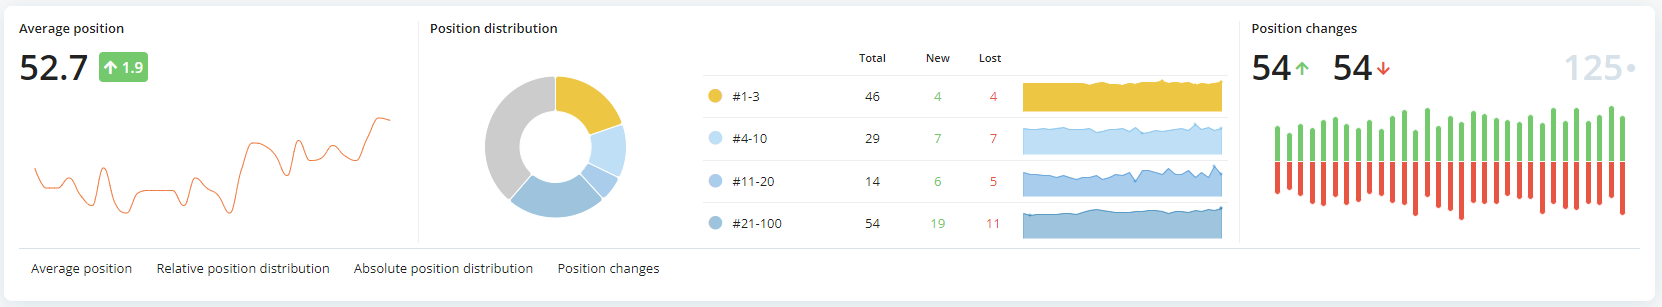
We have divided the new dashboard in 4 sections:
✅ Filters. Now you can select different periods to see the evolution of your project. You can also filter out positions, volume and some other as you could with the old one. The filters would affect both the graphs and the table below.
✅ Headers and mini graphs of project evolution. The headers gives you important information and how it has changed since the beginning of the period. The period is the one selected in the date picker filter. The default is last 30 days.
✅ Detailed graphs. You can see more information in a more detailed way. We have plans to make these graphs more powerful and varied in the near future. You can see the detailed graphs by clicking on the headers.
✅ Table. Now you can see the data aggregated by URL, Location or Tag, so that you can see, for example, the average position of your keywords by each URL. The concept will not change much, but we are now developing a better table component.
Over the coming months we will continue to work on this dashboard to include more data to help your projects 🚀.
We have added the search volume in the email that is automatically sent with the summary of the rise and fall in the rankings of your project's keywords.Email example
We have added the column with the initial position of each keyword (the position in Google on the day the system starts monitoring the positions of that keyword).
We have added a new filter for the keyword list in order to get all the keywords that have cannibalizations 🐞.
In addition to this, if you export the keyword history of the table in CSV, you will also get the history of the cannibalizations.Filter by cannibalizations
From now on you will be able to give access to other users to manage projects within your account.
Important about these sub-accounts: - They will have access only to the projects you choose, but they will have full control over them, even being able to delete them. - They will be able to create new projects. - You can not add email addresses that already have an active TrueRanker account. - This feature will only be available for the Agency plan, which will be able to add a maximum of 10 users.
We hope to make life a little easier for those users who have a team working together.
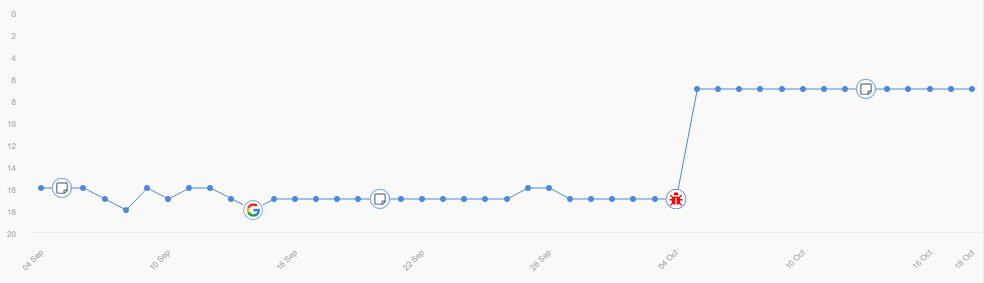
From now on, the URL that is positioning your project will also be shown in the extra information that appears when you place the mouse cursor over each point of the keyword evolution chart.
This way, you will be able to check that Google is always giving priority to the right page and that there are no problems.
When saving the status of the keywords table (order, visibility, etc.) it also saved the pagination by mistake.
This caused that if you moved to another page, when you loaded another project it would start from that page, and might not even show anything if that page did not exist.
This has been fixed and now it always starts from the first page.
Previously the keyword table settings (position, order and visibility of the columns) were saved in the client's own browser and it was necessary to configure each project separately.
Now these settings are stored in the database and are the same for all projects.
This way you gain a lot of usability when you have many projects. In addition these settings are independent of the device where TrueRanker is used.
When you kept the page of a project open for a long time, the session could expire and when opening the popup with the history of a keyword, the loader was frozen and did not show any error.
This has been fixed, closing the popup and showing the related message that you have to log in again.
If you do not want your session to expire, when you log in, check the box to keep your session signed in.
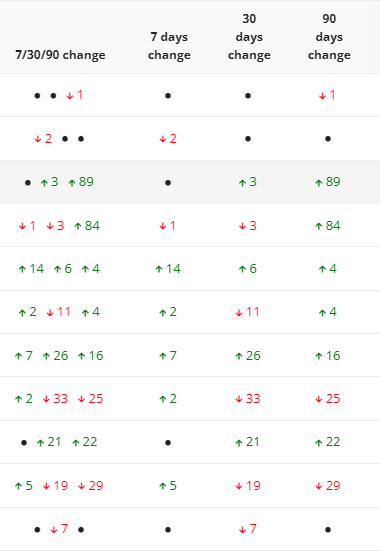
A new column is available in the keywords table to quickly see the change of 7, 30 and 90 days ago compared to the last rank.
In addition, more columns are also available to view this data separately. By default these are not visible, but you can show them in the table settings.
Some keywords with non-Latin characters did not show search volume
Some keywords of non-Latin alphabets showed a search volume equal to 0, as for the rest of Google Ads data.
This has been fixed.
Not to be confused with other reasons why it may show 0.
We use Google Ads API to get the search volume for the keywords, which is quite peculiar.
On the one hand, there are many characters in the keywords that it considers invalid, so no data can be obtained through the API, although it can be obtained through Google Keyword Planner.
On the other side, Google does not show keyword data related to certain topics due to "privacy".
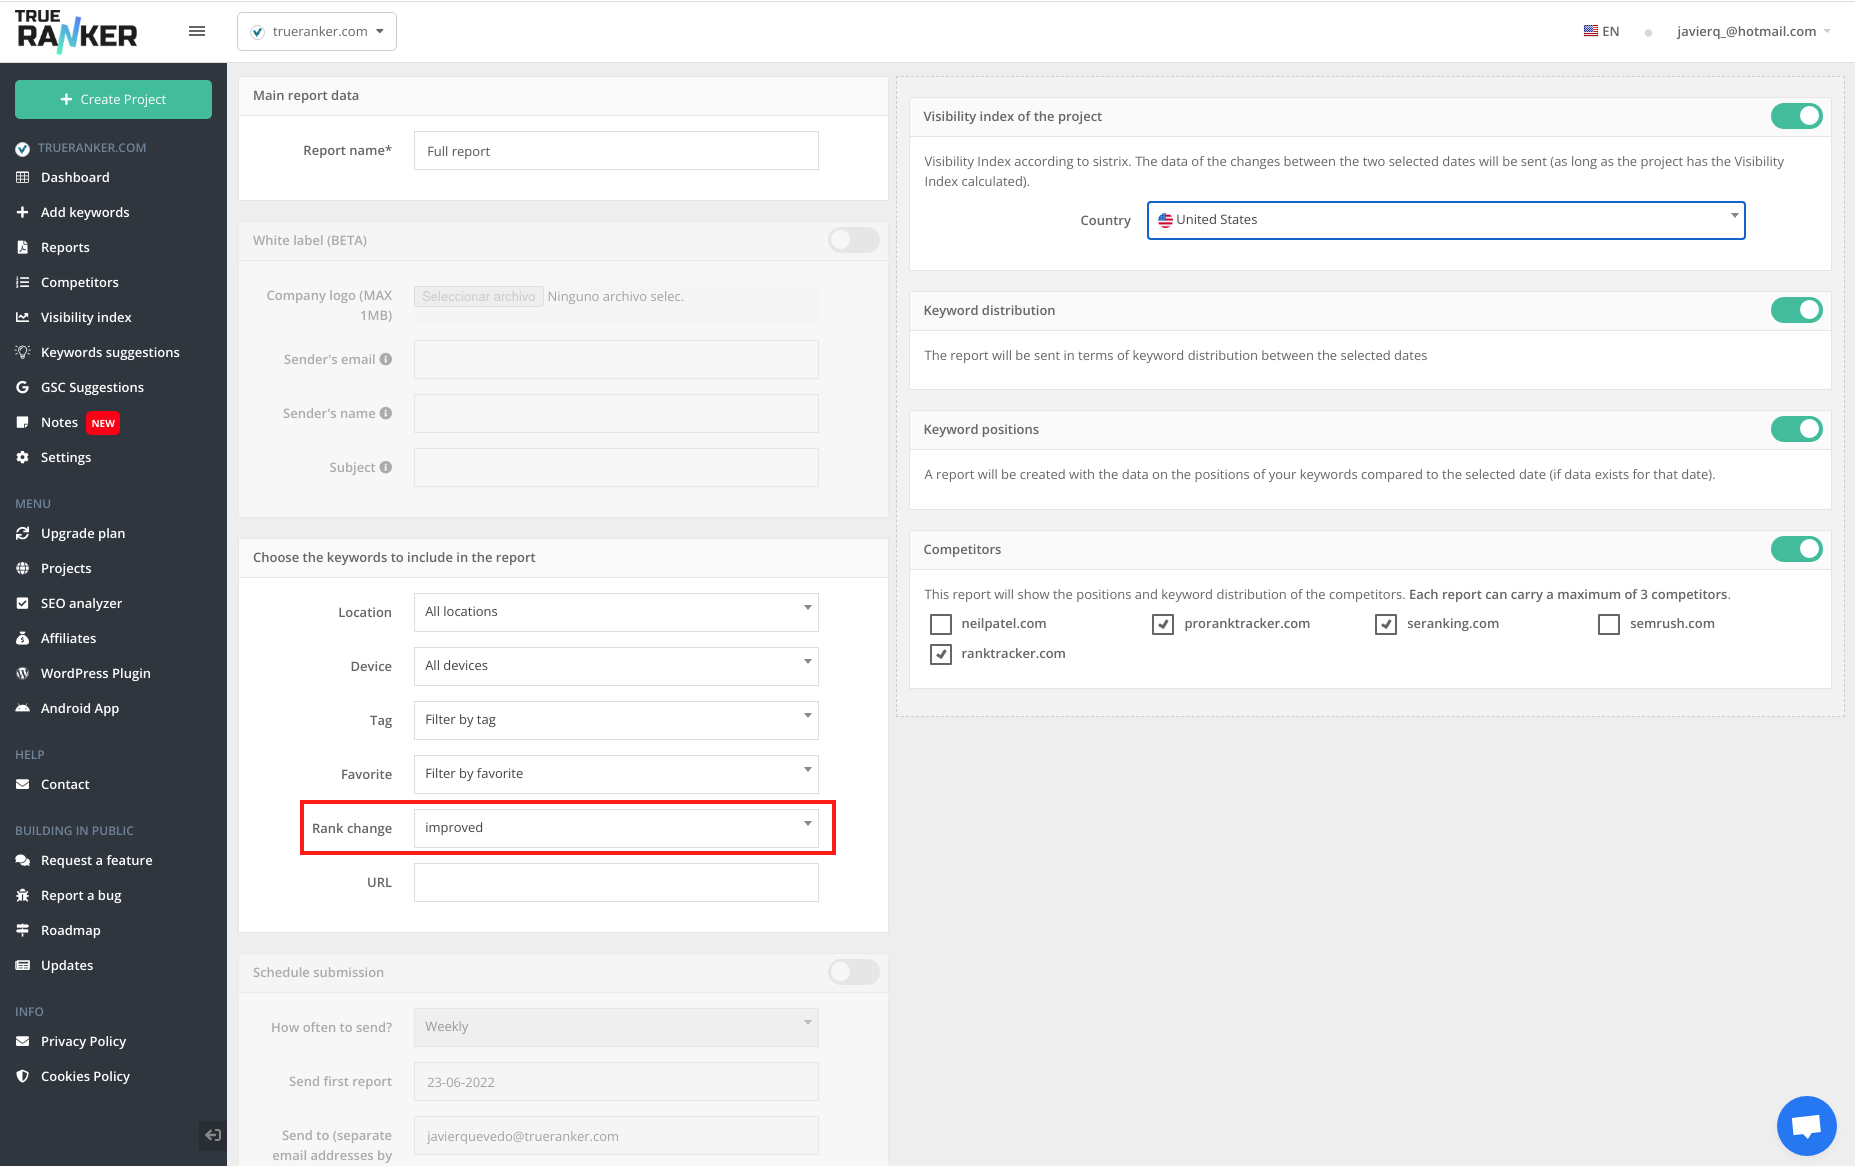
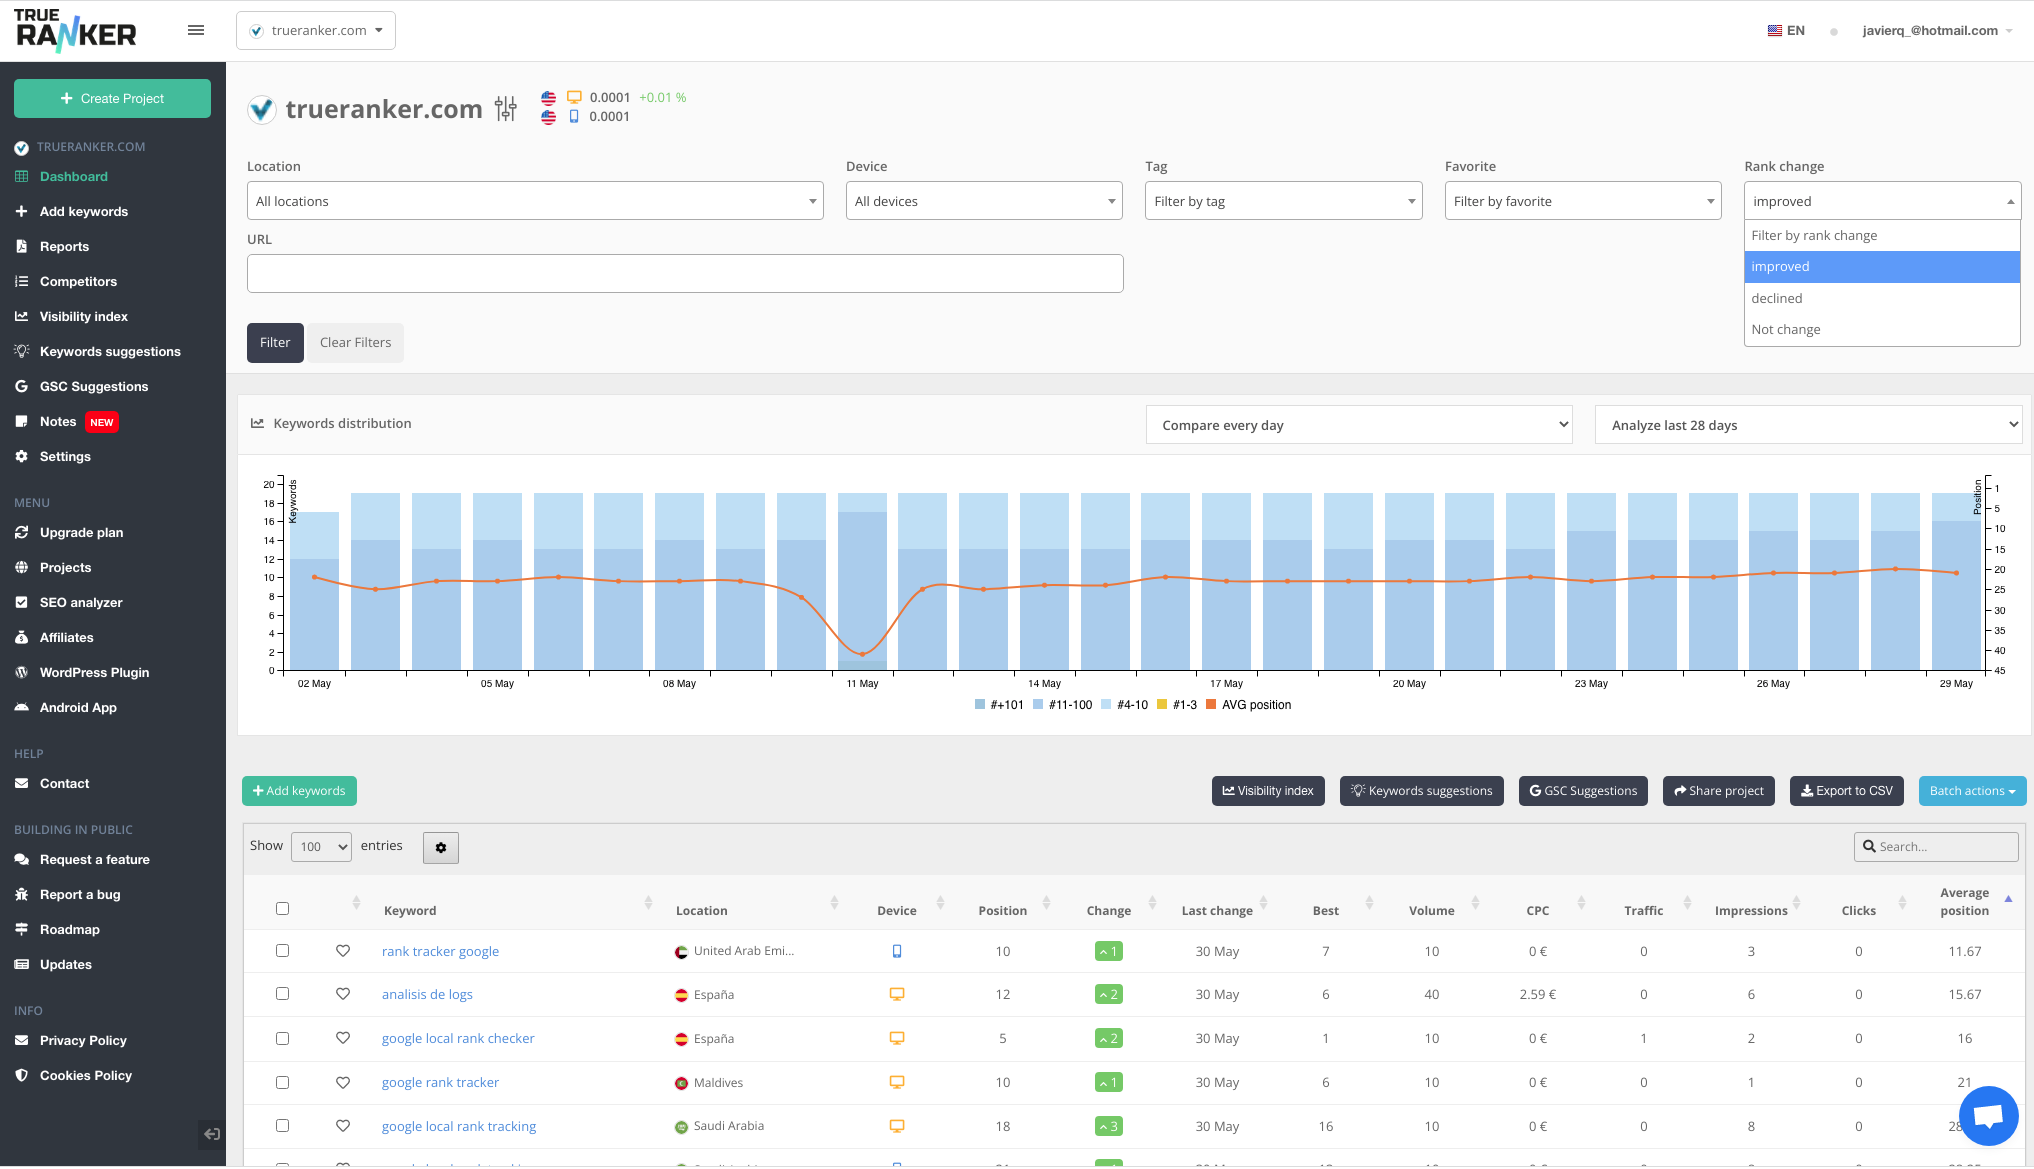
We have added a new filter in the dashboard of each project so you can see the evolution and the list of keywords that have changed in the last 24 hours.
- Keywords that have improved. - Keywords that have worsened. - Keywords that have maintained their position.
In the next days, we will add this filter to the competitors view and to the filters to generate reports.
Since several weeks, a few times Google returns only the first page for mobile searches, instead of showing 100 results.
This means that if your project does not appear on the first page, it stops ranking and shows a 101 position in TrueRanker.
We have greatly reduced the cases where this happens, but it still happens sometime (0.02% of searches).
We will continue to monitor how this problem evolves.
PS: do not confuse this problem with the fact that for certain keywords your project can appear and disappear from Google's top 100. You can always check it by looking at the SERP we have obtained with the magnifying glass button in the actions column.
When connecting a TrueRanker project to a Google Search Console account that did not have that domain linked to it, a 500 error occurred.
Now, in that situation, access to that GSC account is revoked and a message is displayed informing that there is no matching property for the user's project.
If you have your project connected to Google Search Console, you will now be able to see data for impressions, clicks, average position and CTR in the keywords table on the project page.
This data is automatically extracted from your Google Search Console account every 30 days.
More specifically, up to 5,000 keywords are retrieved from the last month sorted in descending order by click count. This data is also used for GSC suggestions.
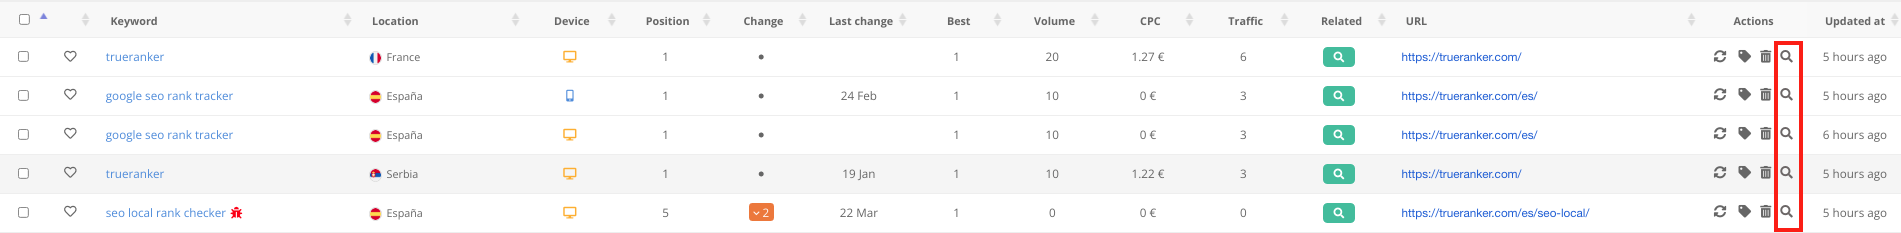
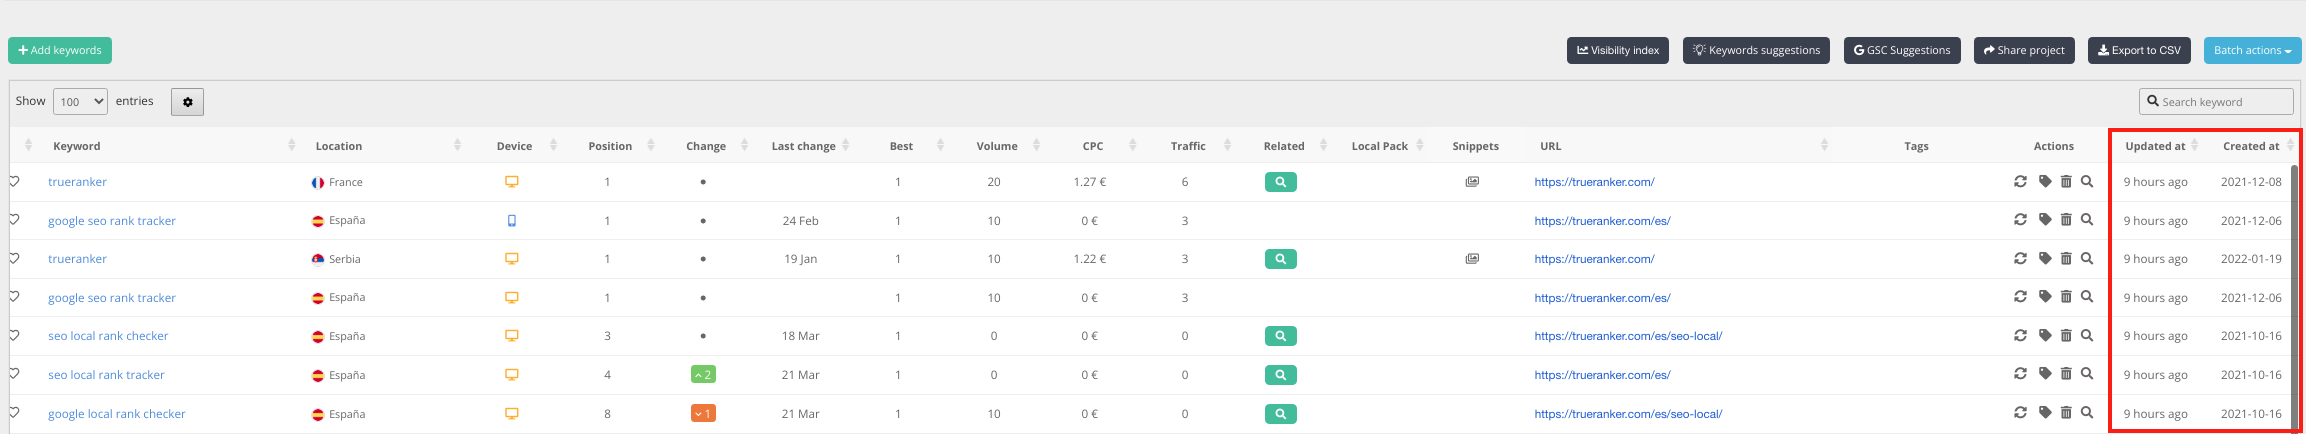
We have added a new field in the table with the date when the keyword was added to the project.
We have also changed the format in which the last position update of the keyword is displayed to show the number of hours that have passed since the update. Best data in keywords table
When exporting project data to CSV it was always considered as if the project type was single domain, showing positions and URLs that might not be as expected.
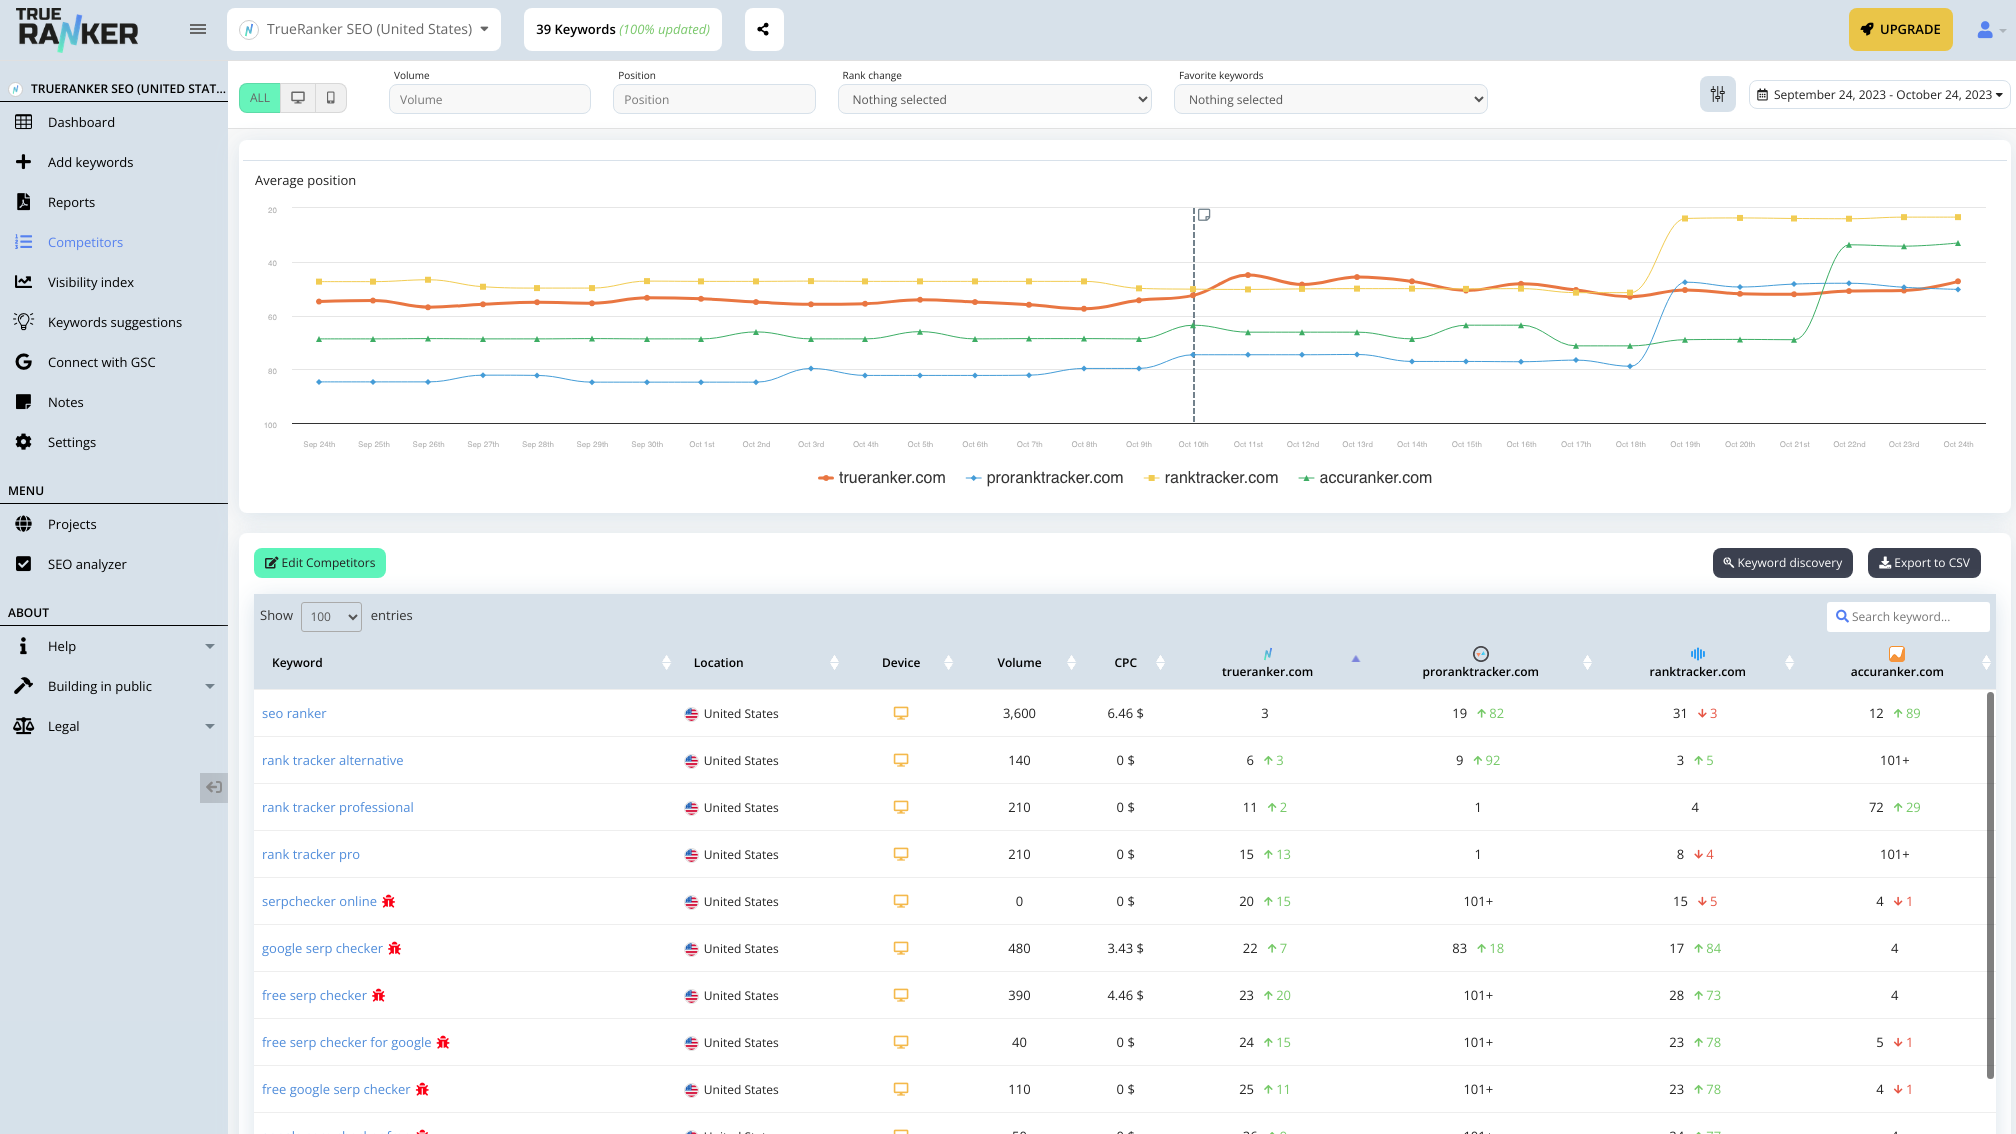
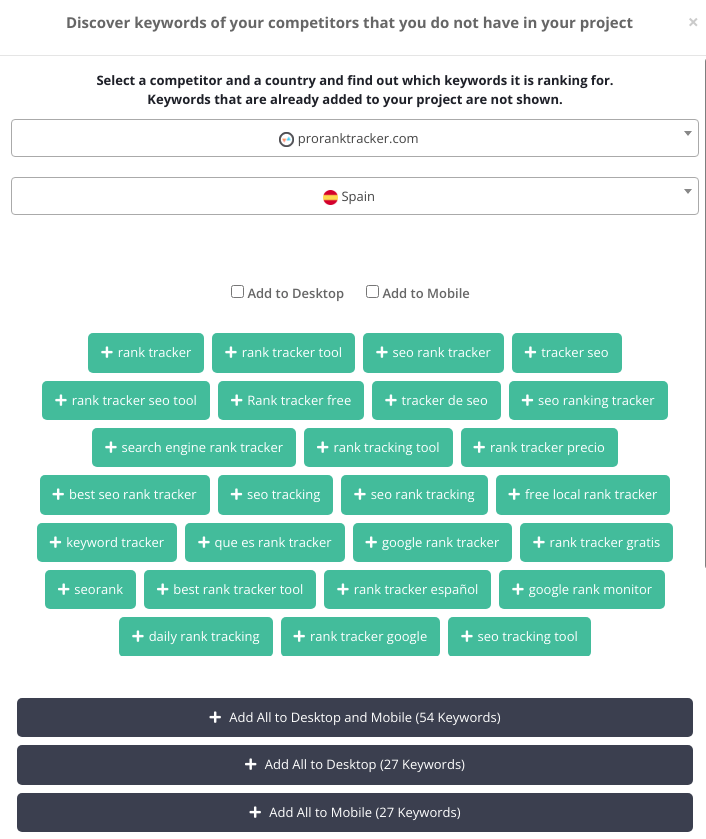
We have implemented a module in the competitors screen to get the kewyords that your competitors are positioning and that you have not added in your project.
This feature can help you discover new keywords that your competitors are using and you are not yet using 🚀Discover your competitor's keywords
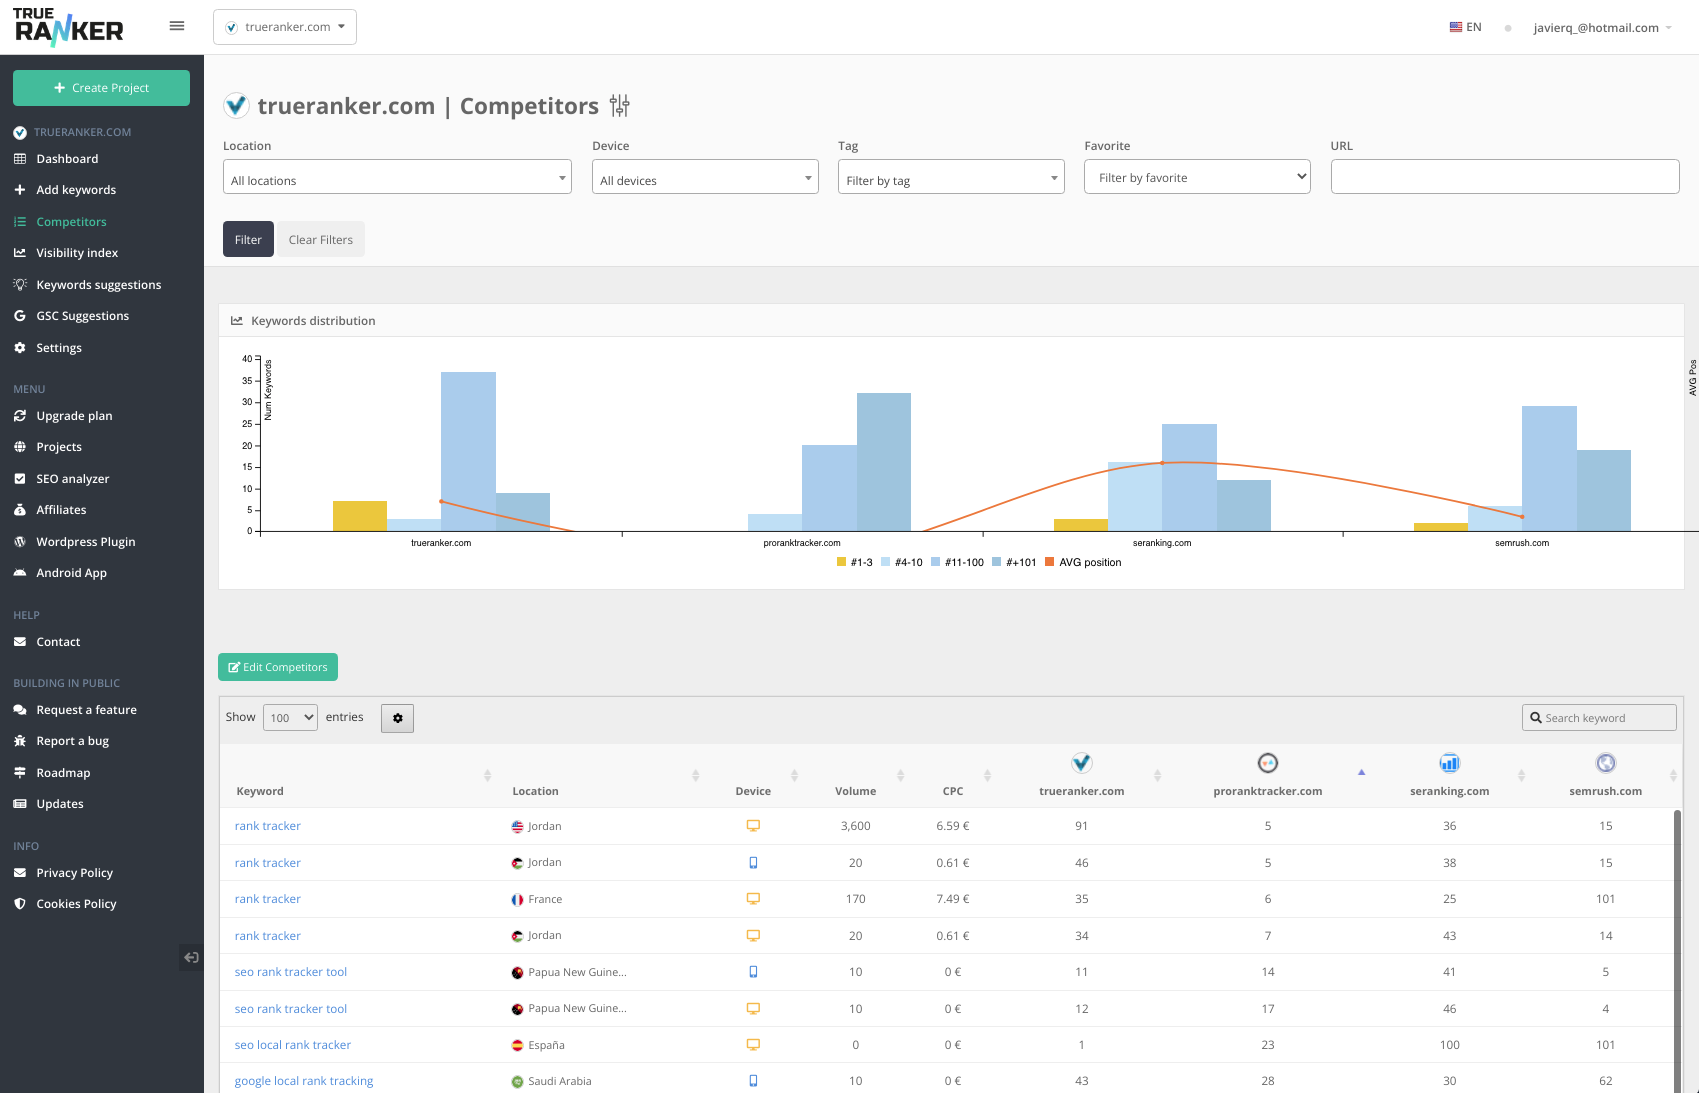
We have added filters in the competitors view to help users read the data more comfortably.
This implementation has involved several internal improvements that will improve the usability and loading times of this view.Add filters options in competitors view
Google Search Console keyword suggestions were only retrieved the first time this feature was used.
Now, if more than 14 days have passed since the last update, the system will automatically refresh these GSC suggestions with a new request to your account.
We continue to improve the keyword tracking system.
We have modified the order of tracking queue to prioritize it according to the country.
Countries where the day starts earlier will have priority, so all users will have a better user experience by waiting less time for their keywords to be tracked from the start of the day.
Still, you can always prioritize your keywords by updating in batch if they are still pending to be searched today. Just use the button for this in the keywords table.
When a project had enough keywords, it was necessary to go to the bottom of the page (by vertically scrolling all the rows) in order to see the horizontal scroll bar and use it to see the columns that were left off the screen.
This made it a very tedious process.
Now this table has a maximum height and quickly displays the horizontal scroll bar.
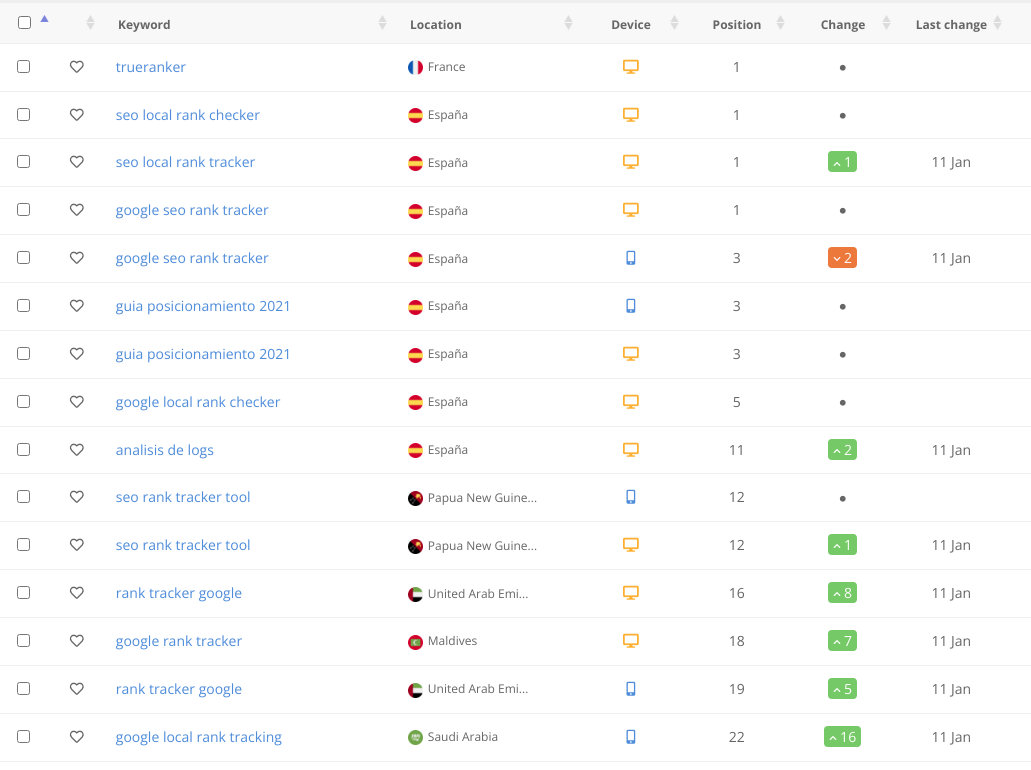
Column with the date of the last change of position in the table of monitored keywords
Last position change column addedWe have added a column with the date when the keyword last changed position. This way, the user will know how long a keyword has been in a fixed position.
PS: This data starts to be collected from today, so previous changes are not reflected in the table.
If the keyword table did not occupy the whole screen, it did not fit. We have made it so that if the table is smaller than the screen it fits the full width of the container ✌️keywords-table-adjust.png261.32 KB
We have implemented an improvement so that the user can choose on which device he/she wants to add the GSC suggestions when clicking on them.gsc-suggestions.png291.85 KB
We have added the keyword distribution data to the project table. We have also made it possible for you to configure this table by choosing the columns you want to see or hide.
Hemos añadido una tabla con el listado de competidores por proyecto con la posición media y la distribución de posiciones de keywords para tener una mejor visión de la competencia.
We have increased and optimized the resources of the keyword tracking system to improve the speed of processing the total number of keywords from all users.
This is an ongoing effort and we will continue to work on it.
The keyword search field was cached, so when you re-entered the project you saw the keywords you had searched for the last time. This generated confusion for some users. We have fixed it.
When you entered the project page through the "add keyword", "keyword suggestions" or "GSC suggestions" links and reloaded the page afterwards, the previous action was launched again. This problem has been solved as well.
Improved popup interface for displaying table visibility options.
Improvements in filter usability: Before, every time the keywords were obtained by filter, the page was reloaded. We have made it so that only the distribution graph and the list of keywords are reloaded to improve the usability of the tool.
We have fixed the keyword suggestion to show them in a pop-up on the same screen as the monitored words. From that pop-up you can add the words one by one or all in bulk.
When adding a long keyword, it was not displayed completely
In the form for adding keywords, while typing a keyword that was too long, it was not displayed at all and it seemed that what had been entered before had disappeared.
Now it is displayed completely all the time, giving no place for error.
Improve loading times and usability on the dashboard of each project
We have implemented internal improvements to improve project loading time. This improvement will be noticed especially by users who have projects with more than 100 monitored keywords.
The project sharing link is now much shorter and more user-friendly.
In addition, it is now also possible to force a new URL, which will cause the previous link to stop working. Ideal if you have already shared a project and want to stop sharing it.
On the competitors page, sometimes the ranking of the competitors shown in the table was not the most recent. However, when clicking on the keyword and displaying the details, it was fine.
This has been corrected and now if it has already been monitored today, it will show today's rank in the table.


 Powered by FeedBear